5. Styles
5.1. Introduction to the Style Interface
The style interface is located under the STYLE panel of the Network Panel.
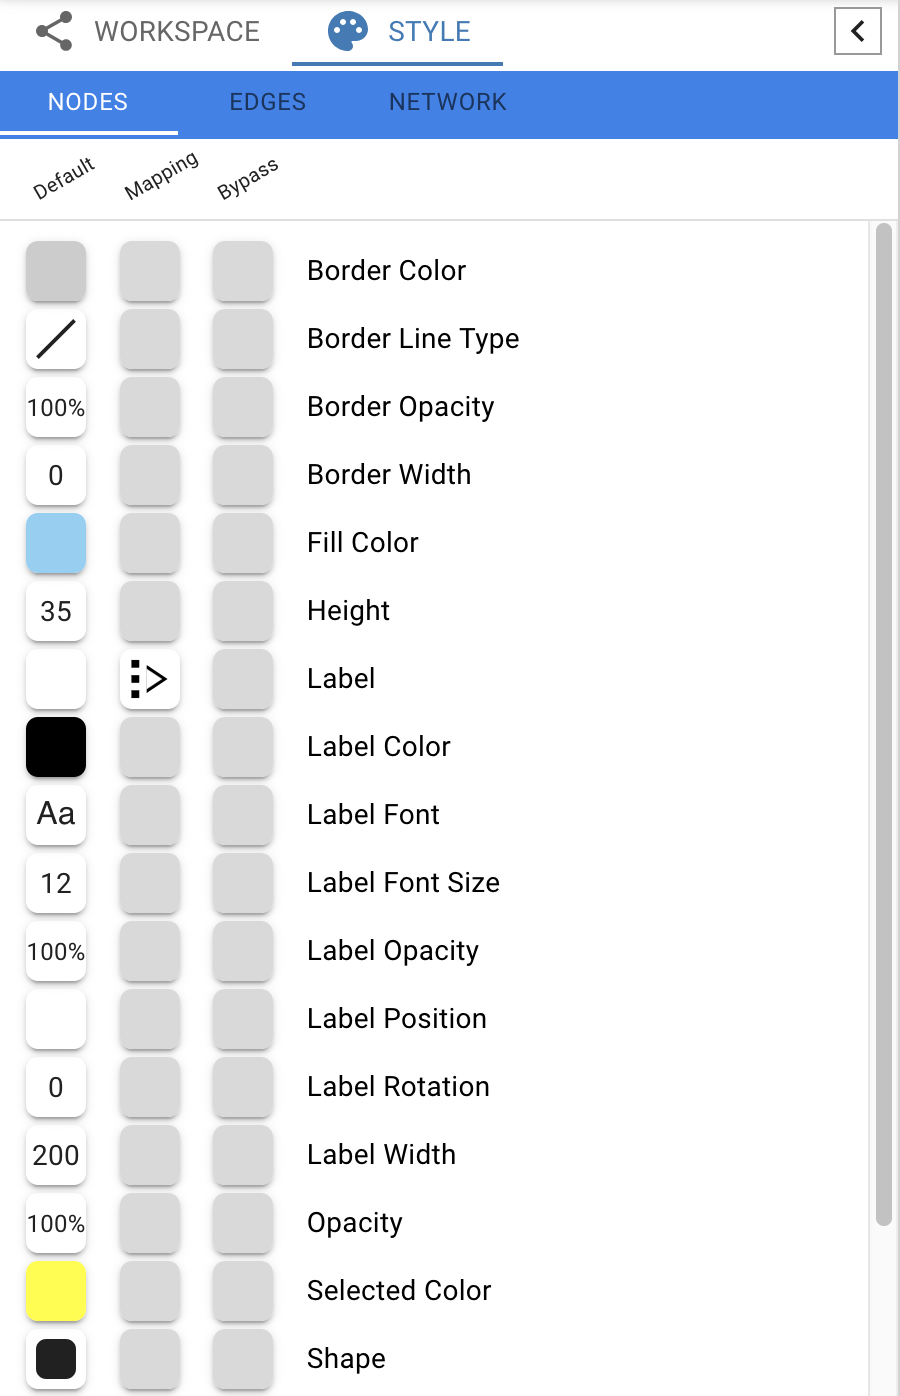
The interface is composed of three tabs, for NODES, EDGES and NETWORK properties.
Each tab contains a list of properties relevant to the current style.
Each property entry in the list has 3 columns:
The Default shows just that, the default value for the property. Clicking on the Default column for any property allows you to change the default value.
Mapping displays the mapping currently in use for the property. Clicking on the Mapping column for any property opens an interface for defining the mapping. Details on the mapping types are provided here.
Bypass displays any style bypass for a selected node or edge. Note that a node/edge or subset of nodes/edges must be selected to activate the Bypass column. Clicking on the Bypass column for selected node(s)/edge(s) allows you to enter a bypass for that property for selected node(s)/edge(s).
The Default Value is used when no mapping is defined for a property, or for nodes/edges not covered by a mapping for a particular property. If a Mapping is defined for a property, this defines the style for all or a subset of nodes/edges, depending on how the mapping is defined. A Bypass on a specific set of nodes/edges will bypass and override both the default value and defined mapping.
How Mappings Work
For each property, you can specify a default value or define a dynamic mapping. Cytoscape currently supports three different types of mappings:
Passthrough Mapping
The values of network column data are passed directly through to properties. A passthrough mapping is typically used to specify node/edge labels. For example, a passthrough mapping can label all nodes with their common gene names.
Discrete Mapping
Discrete column data are mapped to discrete properties. For example, a discrete mapping can map different types of molecules to different node shapes, such as rectangles for gene products and ellipses for metabolites.
Continuous Mapping
Continuous data are mapped to properties. Depending on the property, there are three kinds of continuous mapping:
    i.  **Continuous-to-Continuous Mapping**: for example, you can
        map a continuous numerical value to node size.

    ii. **Color Gradient Mapping**: This is a special case of
        continuous-to-continuous mapping. Continuous numerical
        values are mapped to a color gradient.
List of Node, Edge and Network Properties
The style of a variety of properties can be controlled, summarized in the tables below.
| Node Property | Description |
|---|---|
| Border Color | The color of the border of the node. |
| Border Line Type | The type of line used for the border of the node. |
| Border Opacity | The opacity of the color of the border of the node. 0% means totally transparent, and 100% means totally opaque. |
| Border Width | The width of the node border. |
| Fill Color | The color of the node. |
| Height | The height of the node. Height will be independent of width. |
| Label | The text used for the node label. |
| Label Color | The color of the node label. |
| Label Font | The font used for the node label. |
| Label Font Size | The size of the font used for the node label. |
| Label Opacity | The opacity of the node label. 0% means totally transparent, and 100% means totally opaque. |
| Label Position | The position of the node label relative to the node. |
| Label Rotation | The rotation of the node label, default is 0. |
| Label Width | The maximum width of the node label. |
| Opacity | The opacity of the color of the node. 0% means totally transparent, and 100% means totally opaque. |
| Selected Color | The fill color of the node when selected. |
| Shape | The shape of the node. |
| Visibility | Hides the node if set to false. By default, this value is set to true. |
| Width | The width of the node. Width will be independent of height. |
| Z Order | Z location of the node. Default value of this will be ignored. The value will be used only when mapping function is defined. |
| Edge Property | Description |
|---|---|
| Label | The text used for the edge label. |
| Label Color | The color of the edge label. |
| Label Font | The font used for the edge label. |
| Label Font Size | The size of the font used for the edge label. |
| Label Opacity | The opacity of the color of the edge label. 0% means totally transparent, and 100% means totally opaque. |
| Label Rotation | The rotation of the edge label, default is 0. |
| Label Width | The width of the edge label. |
| Line Type | The type of stoke used to render the line (solid, dashed, etc.) |
| Opacity | The opacity of the of the edge. 0% means totally transparent, and 100% means totally opaque. |
| Selected Color | The color of the whole edge (stroke and arrows) when selected. |
| Source Arrow Color | The color of the arrow on the source node end of the edge. |
| Source Arrow Shape | The shape of the arrow on the source node end of the edge. |
| Stroke Color | The color of the edge line. |
| Target Arrow Color | The color of the arrow on the target node end of the edge. |
| Target Arrow Shape | The shape of the arrow on the target node end of the edge. |
| Visible | Hides the edge if set to false. By default, this value is set to true. |
| Width | The width of the edge line. |
| Source Arrow Selected Paint | The selected color of the arrow on the source node end of the edge. |
| Stroke Color (Selected) | The color of the edge line when selected. |
| Target Arrow Selected Paint | The selected color of the arrow on the target node end of the edge. |
| Color (Unselected) | The color of the whole edge (stroke and arrows) when it is not selected. |
| Z Order | The ordering for overlapping edges. Edges with a lower value will be underneath edges with a higher value. Default value of this will be ignored. The value will be used only when mapping function is defined. |
| Network Property | Description |
|---|---|
| Background Color | The background color of the network view. |
5.2. Styles Tutorial
The following tutorial demonstrate some of the basic style features.
Creating a Basic Style with Discrete and Continuous Mappings
First, we will update the default values for two node properties:
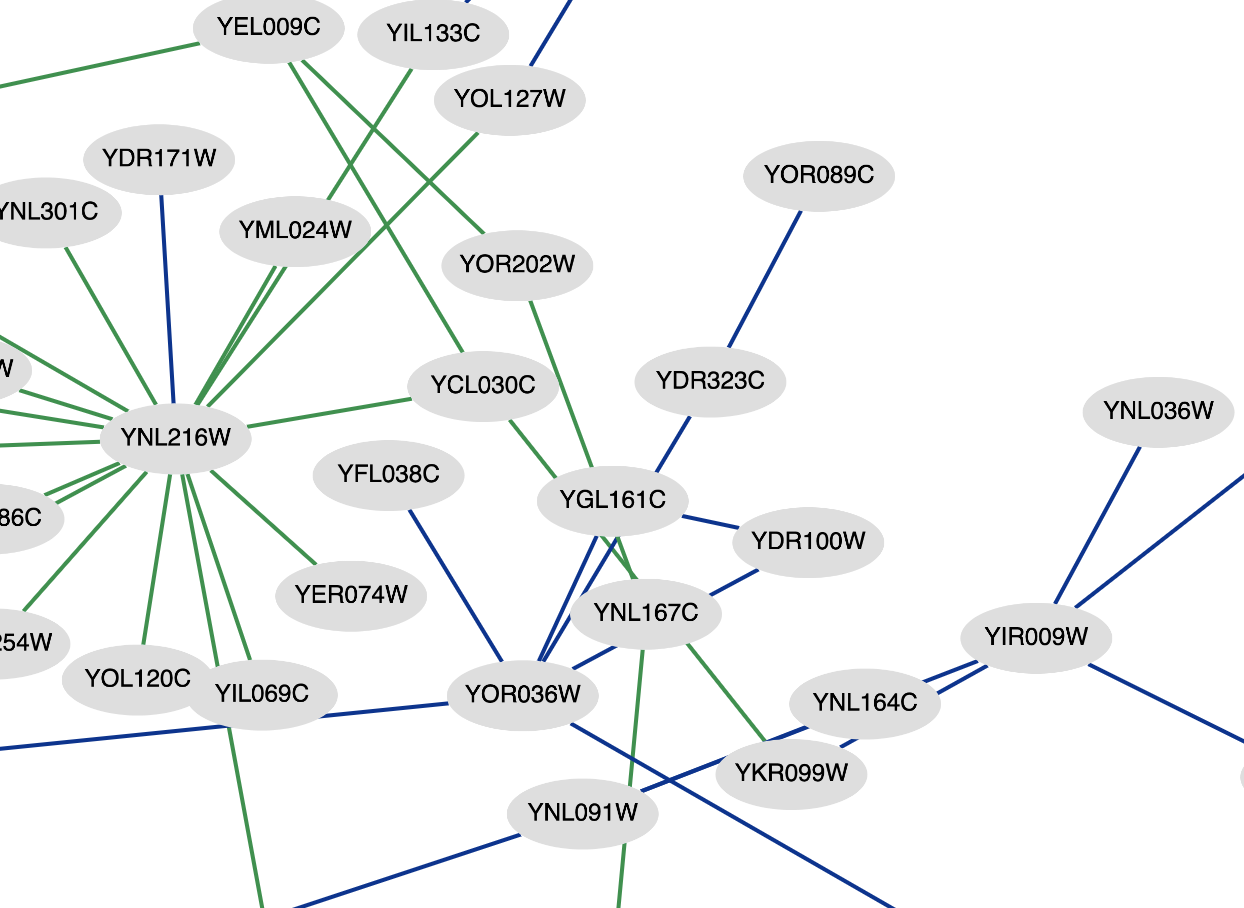
Load a sample network via Data → Open network(s) from NDEx in the Menu Bar. In the NDEx Network Browser window, search for galfiltered and open the galFiltered network with data.
Select the STYLE panel in the Network Panel. Default values are defined for some of the properties.
To set the default node shape to oval, click the Default column for the Shape property in the NODES tab. Select the ellipse item and click CONFIRM.
Similarly, click the Default column for Fill Color and set it to light grey.
Next, we will use discrete mappings for edge style properties:
In the EDGE tab of the STYLE panel, find the Stroke Color property and click on the Mapping column. Under Column, select interaction.
Under Mapping Type, select discrete. The interface will now show all available column values for interaction:
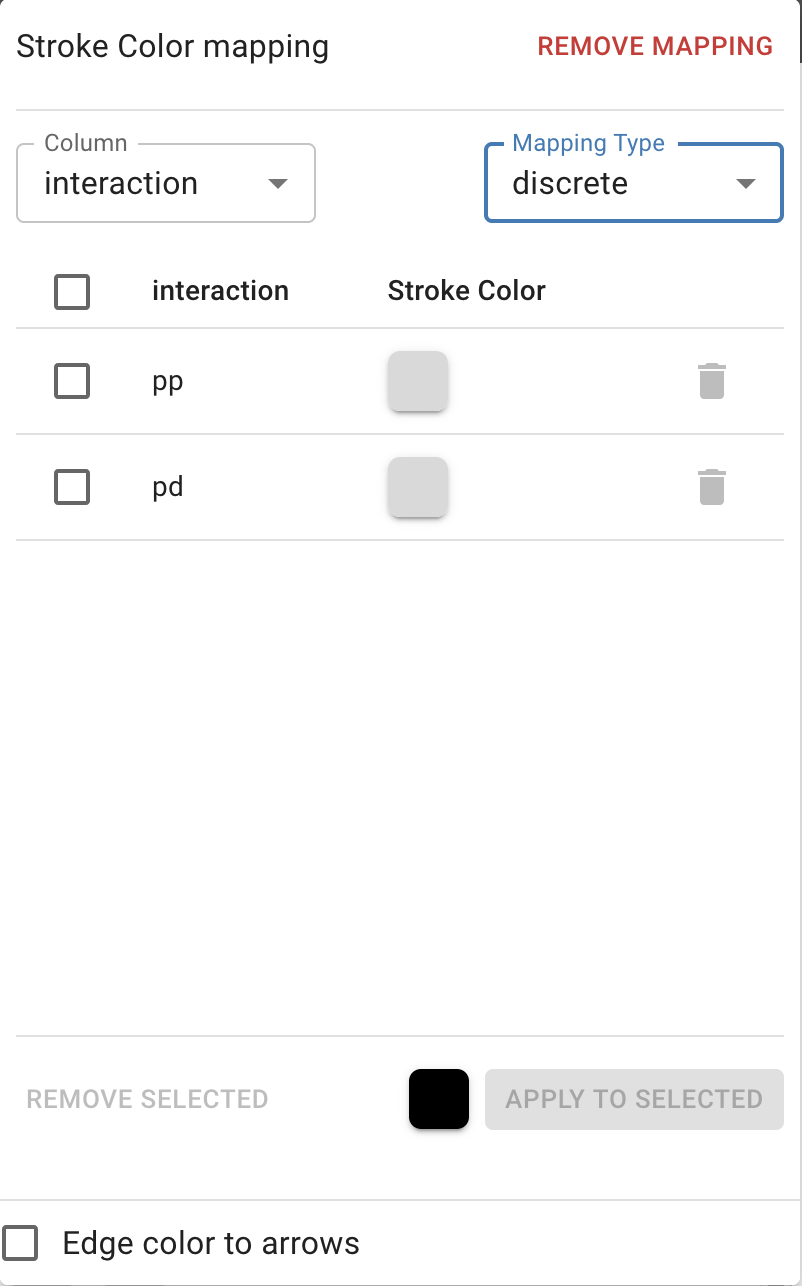
Click the box next to pp (protein-protein interactions), select a dark blue color, then click CONFIRM. Repeat the process with pd (protein-DNA interasctions) and select a green color.
Next, let’s create continuous mappings for nodes:
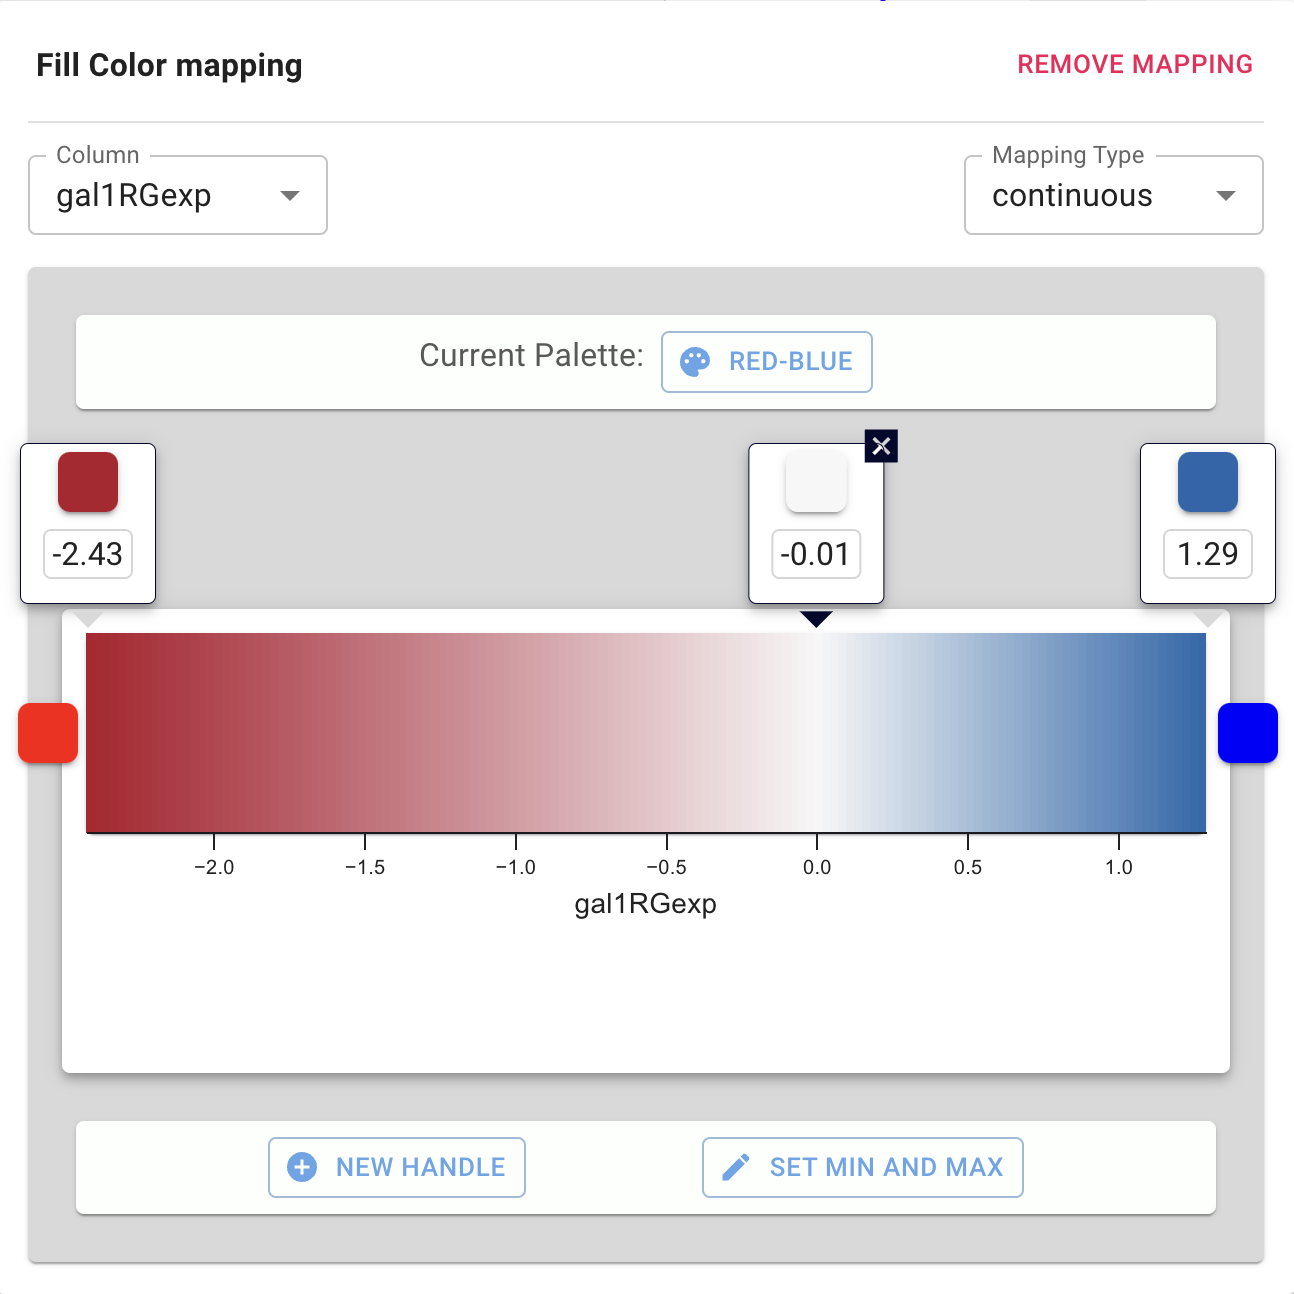
In the NODES tab of the STYLE panel, find the Fill Color property. Click on the Mapping column.
Under Column, select gal1RGexp from the drop-down list that appears.
Select the “continuous” option as the Mapping Type. This automatically creates a default mapping using a default palette.
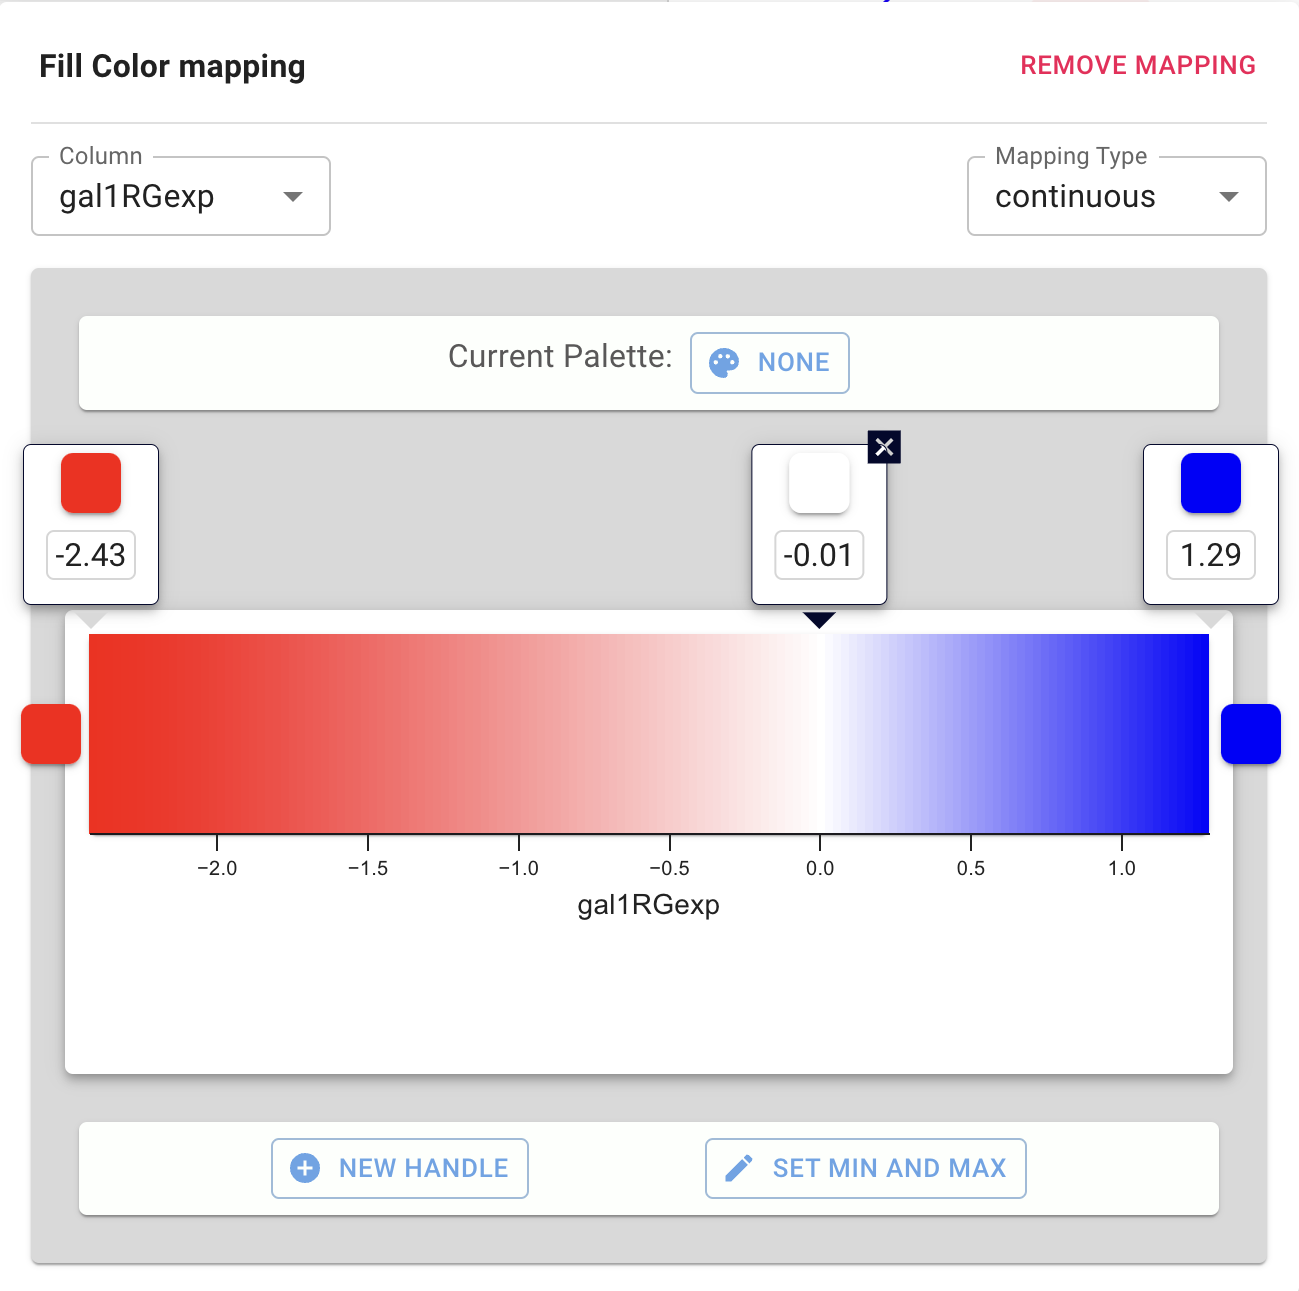
Let’s update the palette by clicking the Current Palette button. Select the Red-Blue palette on the left and click OK.
The available palettes come from published recommendations for choosing colors in scientific and cartographic applications, such as BrewerColors.