2. Quick Tour of Cytoscape Web
This chapter describes the basic layout and mechanics of using Cytoscape Web. When you start Cytoscape Web for the first time, the interface will look like the image below:
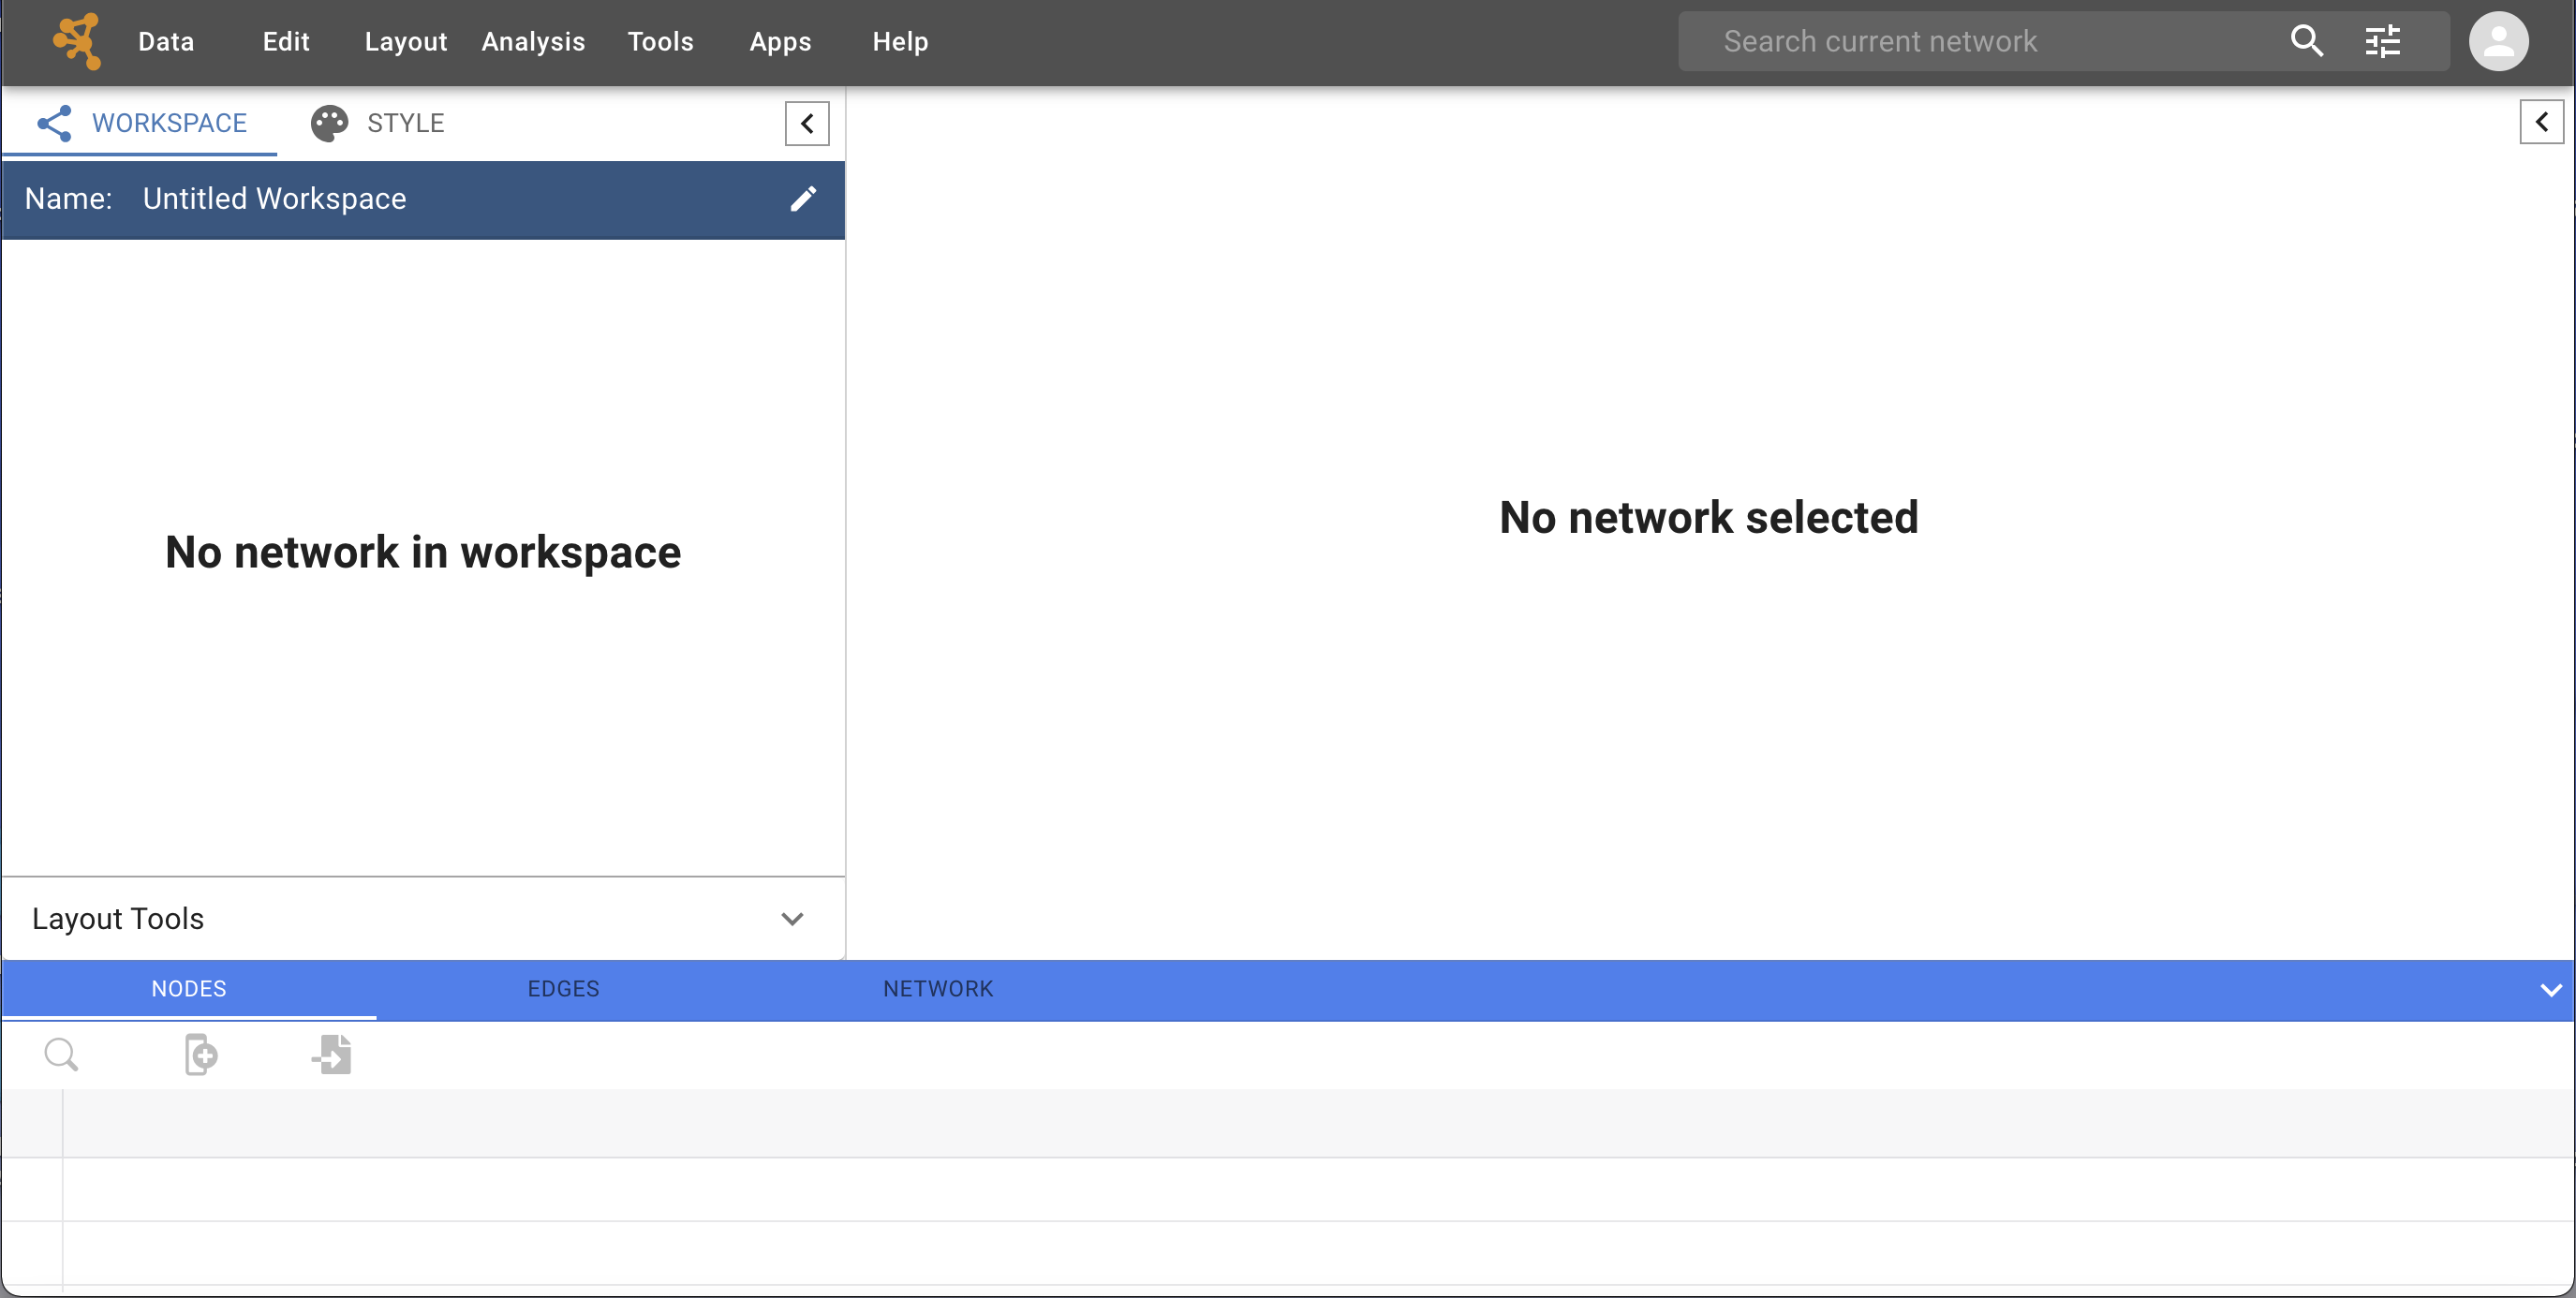
The interface layout is very similar to that of the Cytoscape desktop application, whith the Control Panel on the left, Table Panel at the bottom and Network View Panel on the right.
When a network is loaded, Cytoscape Web will look similar to the image below:
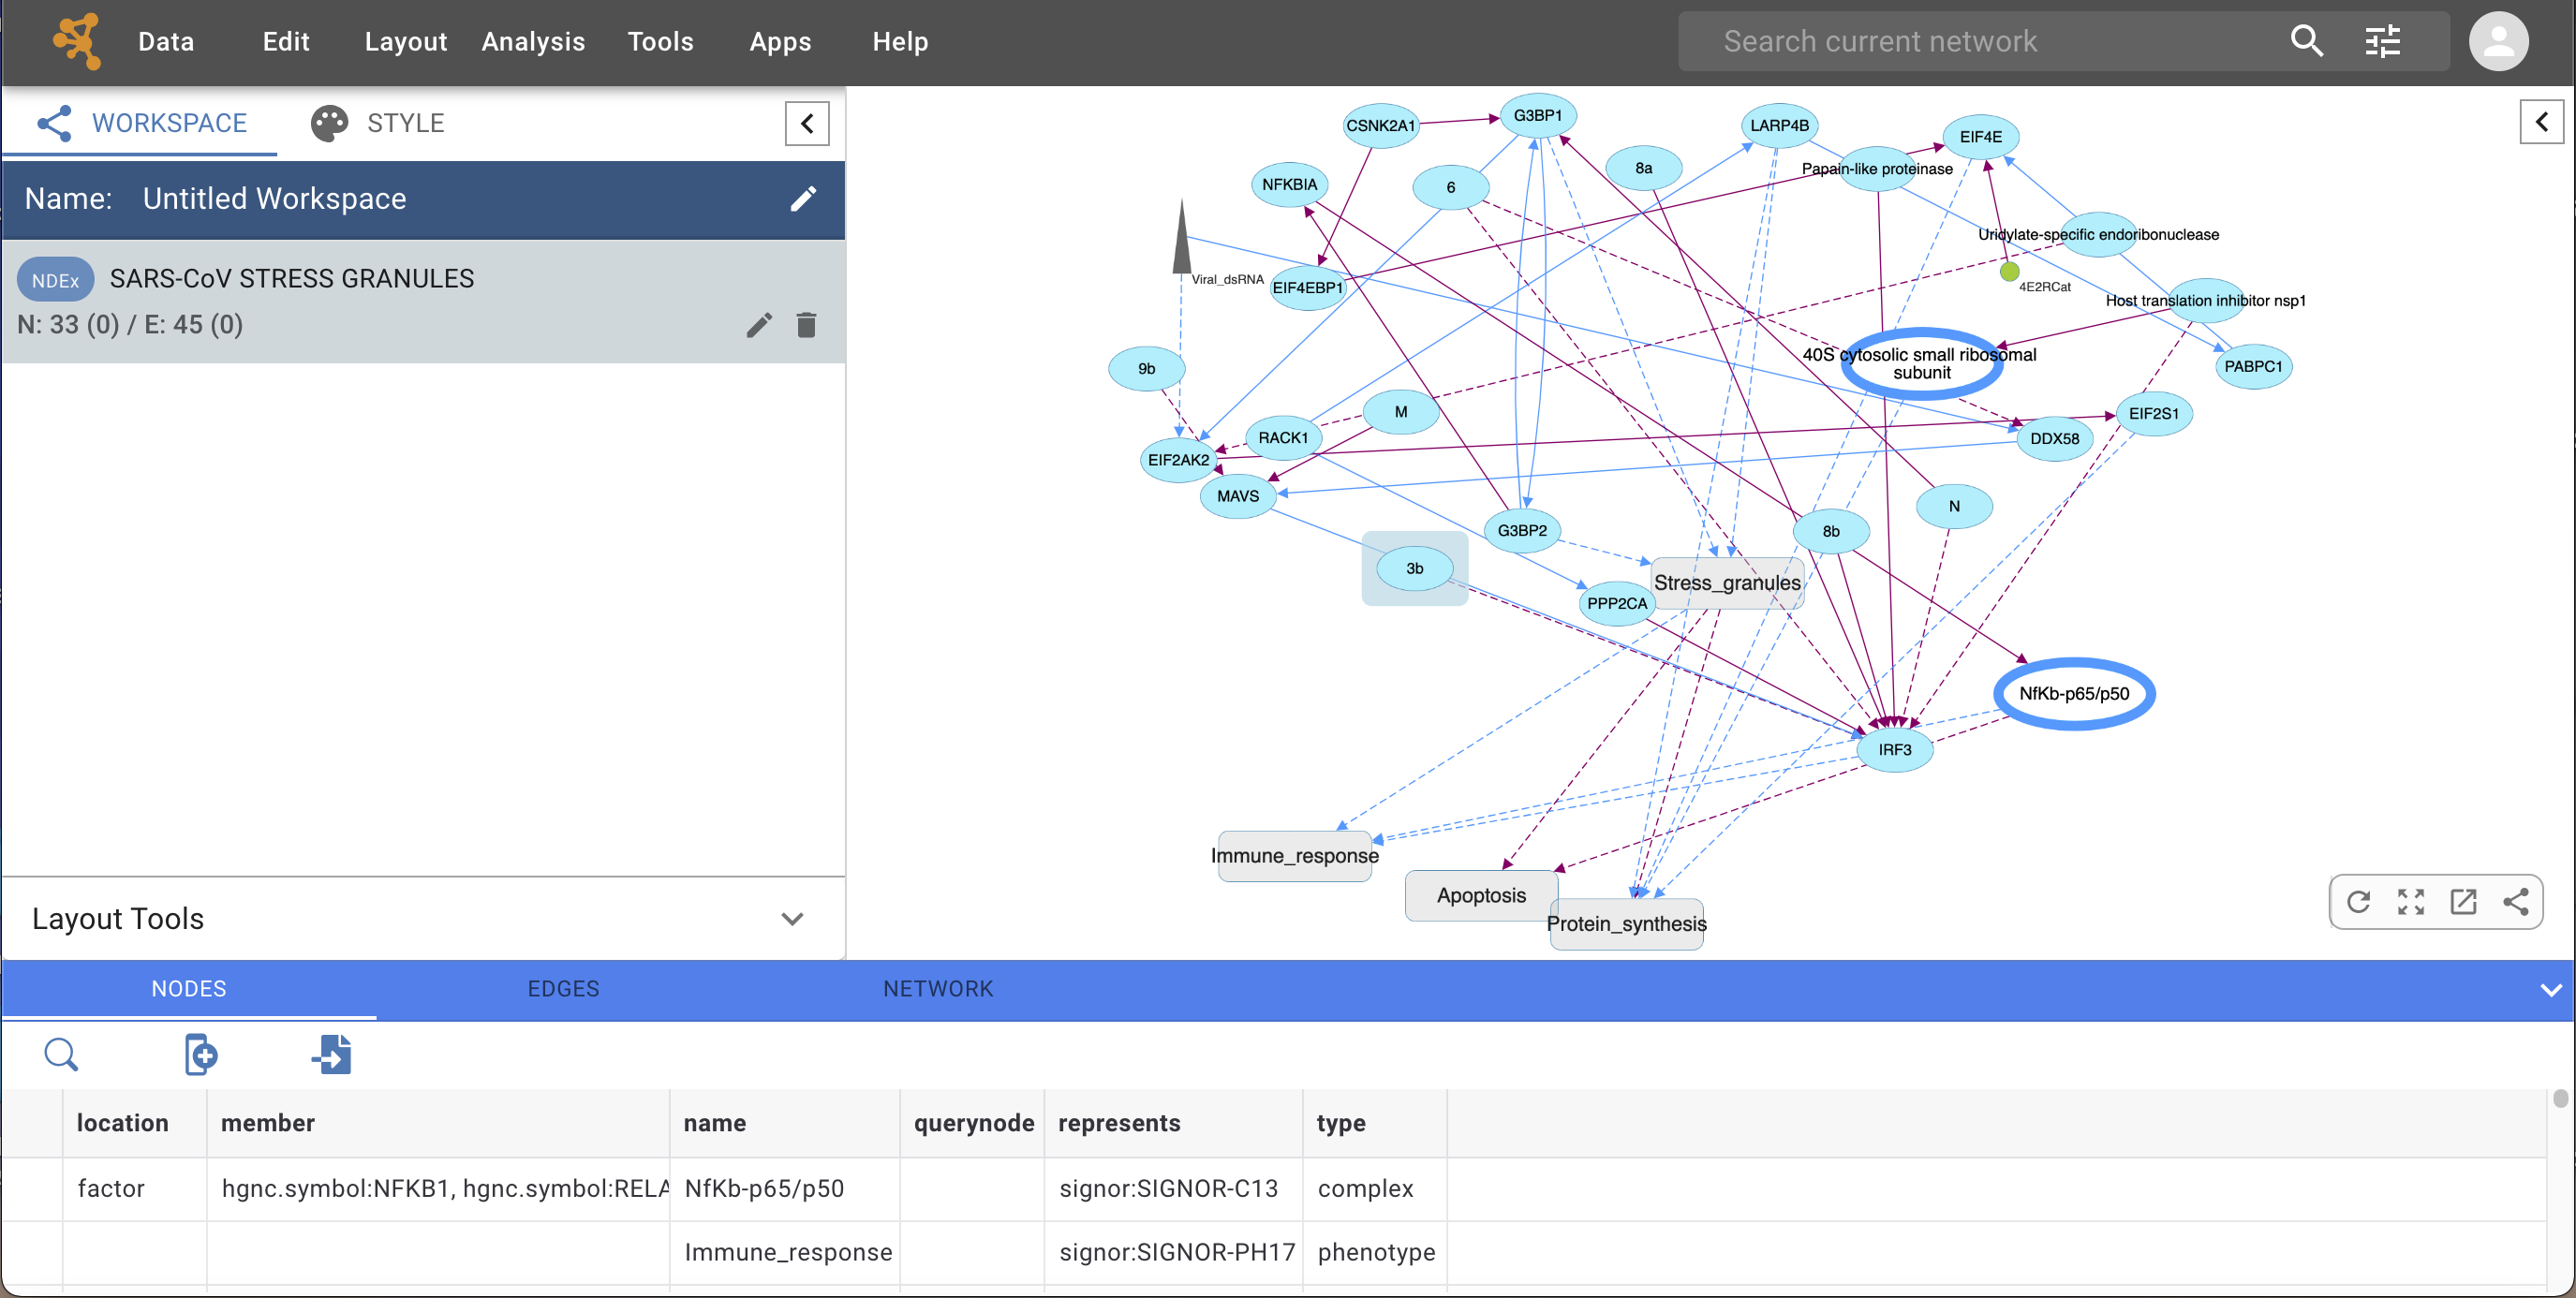
Most functionalities are self-explanatory, but we’ll go through a concise explanation of the interface components for clarity.
The Menu Bar is at the top of the screen and contains several options (see below for more information about each menu). Also in the Menu Bar, to the right, are the Search Tool and NDEx Login button.
The Workspace Panel (Workspace tab of the Control Panel). This is where all the networks you are working with are listed. You can have several networks in your workspace, but only one of them can be selected and dispayed at any given time; this is called the ‘current’ network.
The Network View Panel displays the current network. At the bottom right corner of the network view are a set of network view tools, mouse over for more information on each tool.
The full-width Table Panel uses the bottom portion of the screen and displays columns of data for nodes and edges in your network. The table also allows you to modify the values of column data.
The Workspace Panel and Table Panel can be resized according to your preference or even fully collapsed to maximize the screen space available for the Network View Panel.
2.1. The Menu Bar
Data
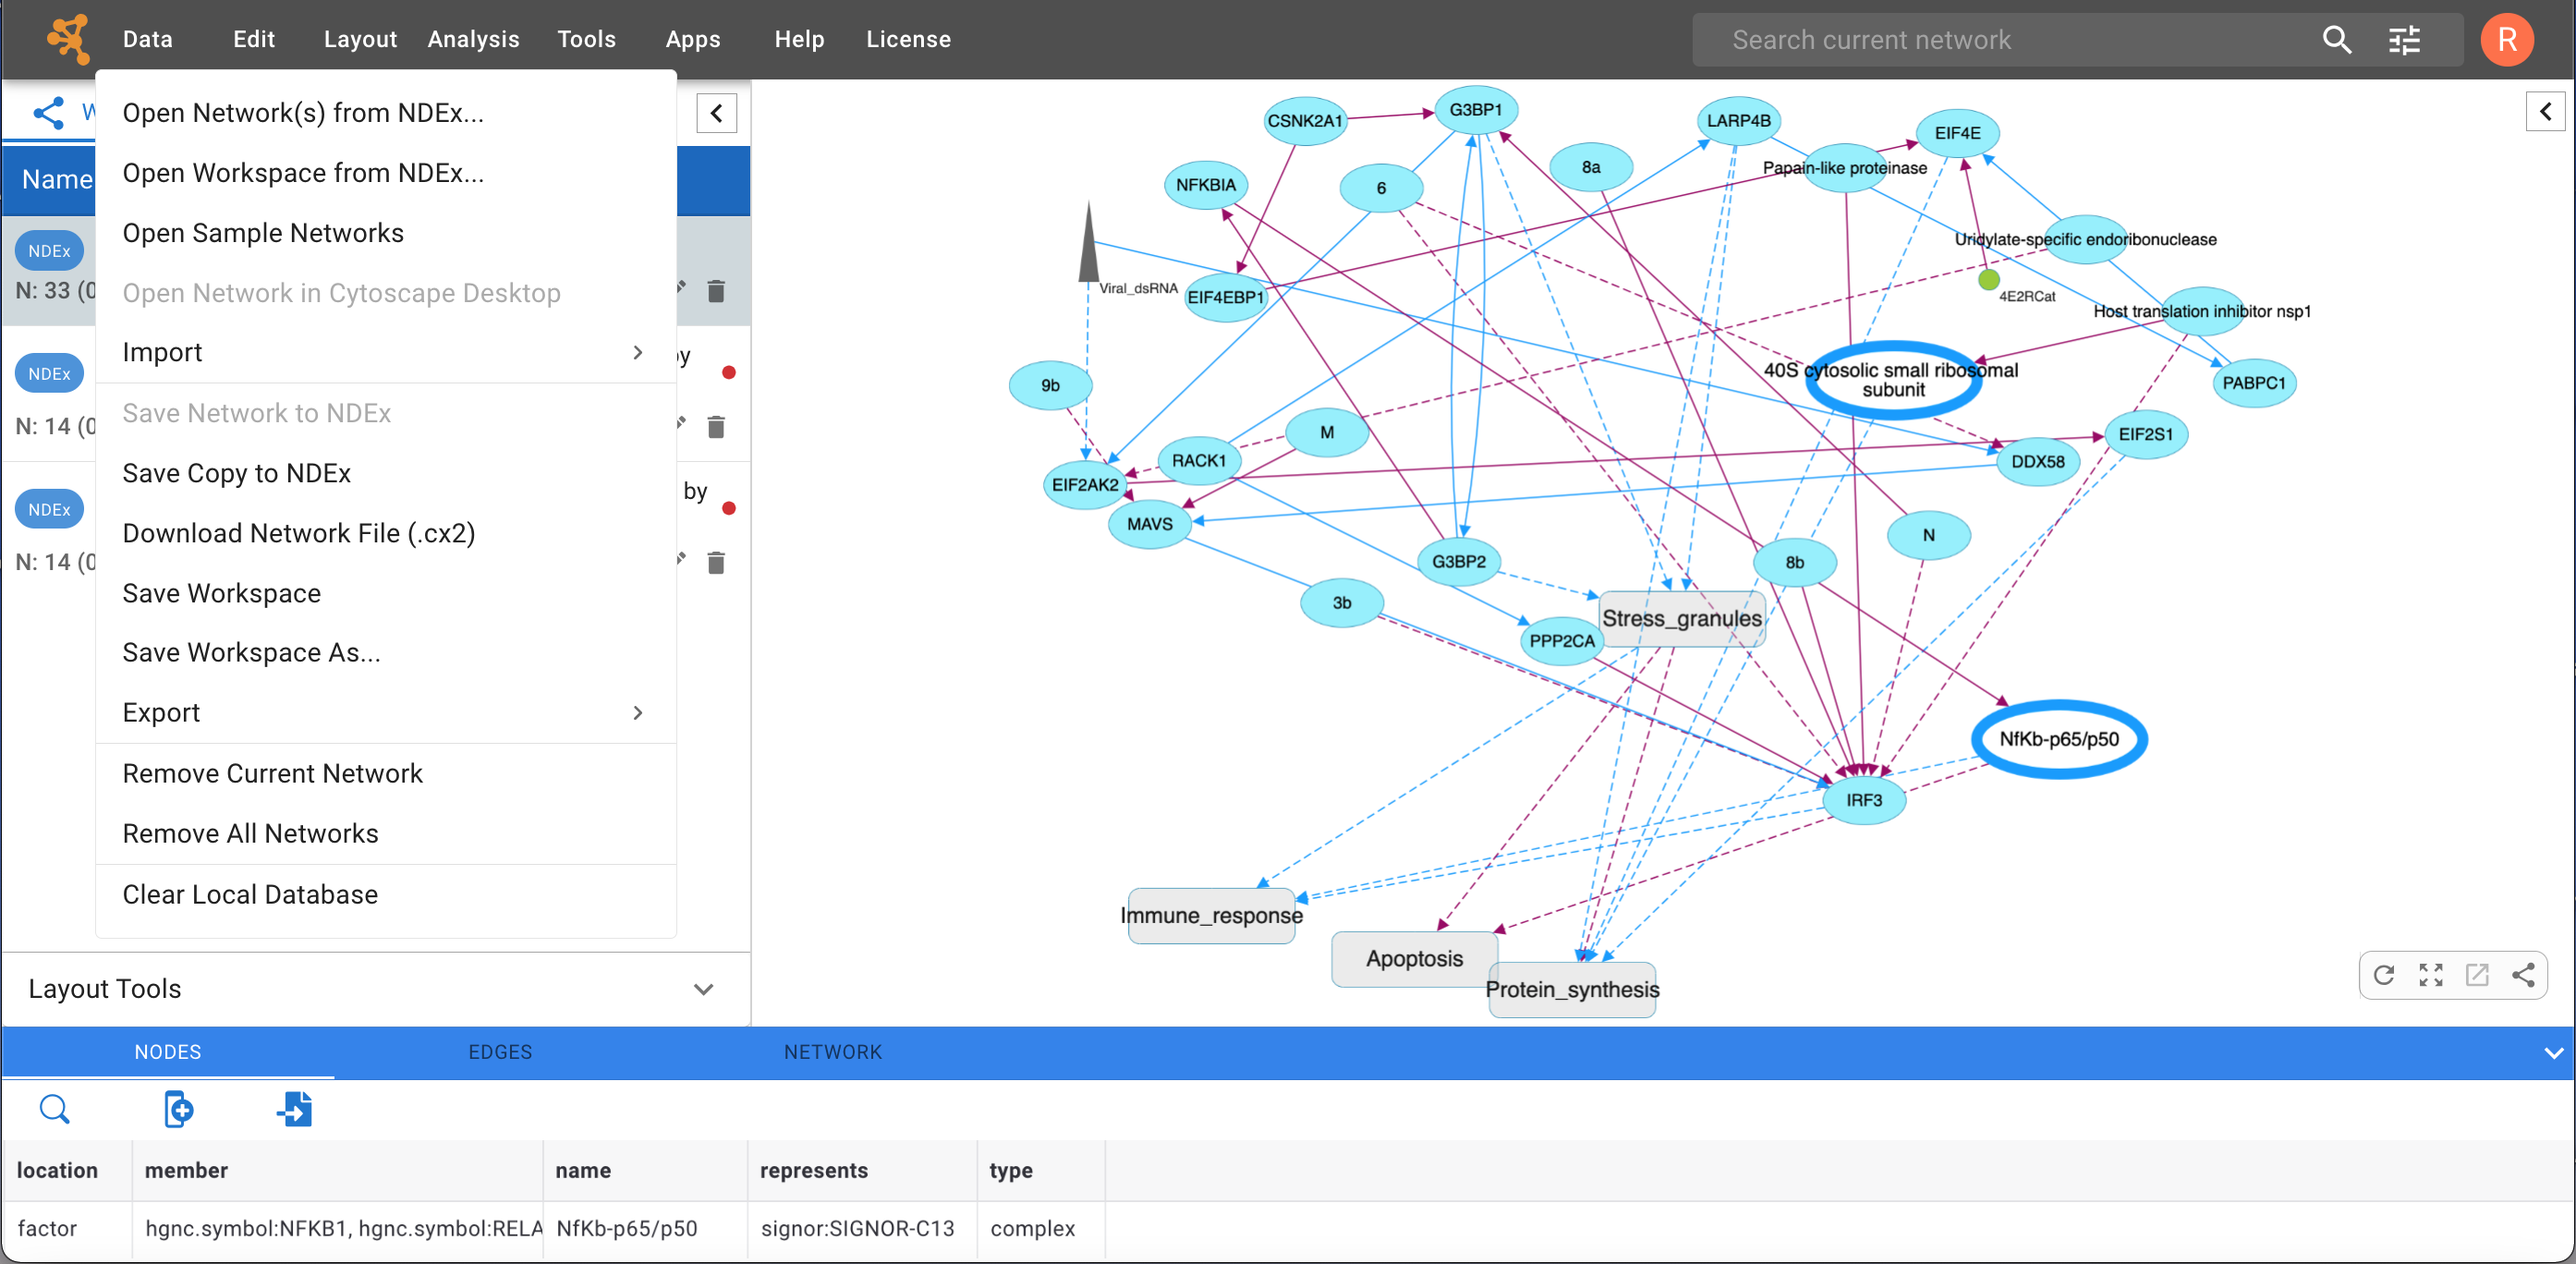
As shown in the image below, the Data menu contains most basic file functionality:
Data → Open for opening NDEx networks and workspaces
Data → Save for saving networks and workspaces to NDEx
Data → Import for importing data such as networks and tables
Data → Export for exporting data
Data → Remove for removing networks
Data → Clear Local Database for resetting your Cytoscape Web instance and starting over with a clean slate.
For more details, please review the chapters on Creating and Saving Networks and Exporting Your Data.
Edit
The Edit menu allows to:
Delete the currently selected nodes/edges of a network
Perform undo/redo actions.
Additional options will be added in future releases.
Layout
The Layout menu lists a variety of layout algorithms that can easily be applied to your network with just 1 click. Choosing any of these options will lay the network out using the default settings for that algorithm. In this version of Cytoscape Web, the available options are:
Compound Spring Embedder (COSE)
Cosmos
Force-directed (gForce)
Circular
Concentric
Grid
Radial
Hierarchical (DAGRE)
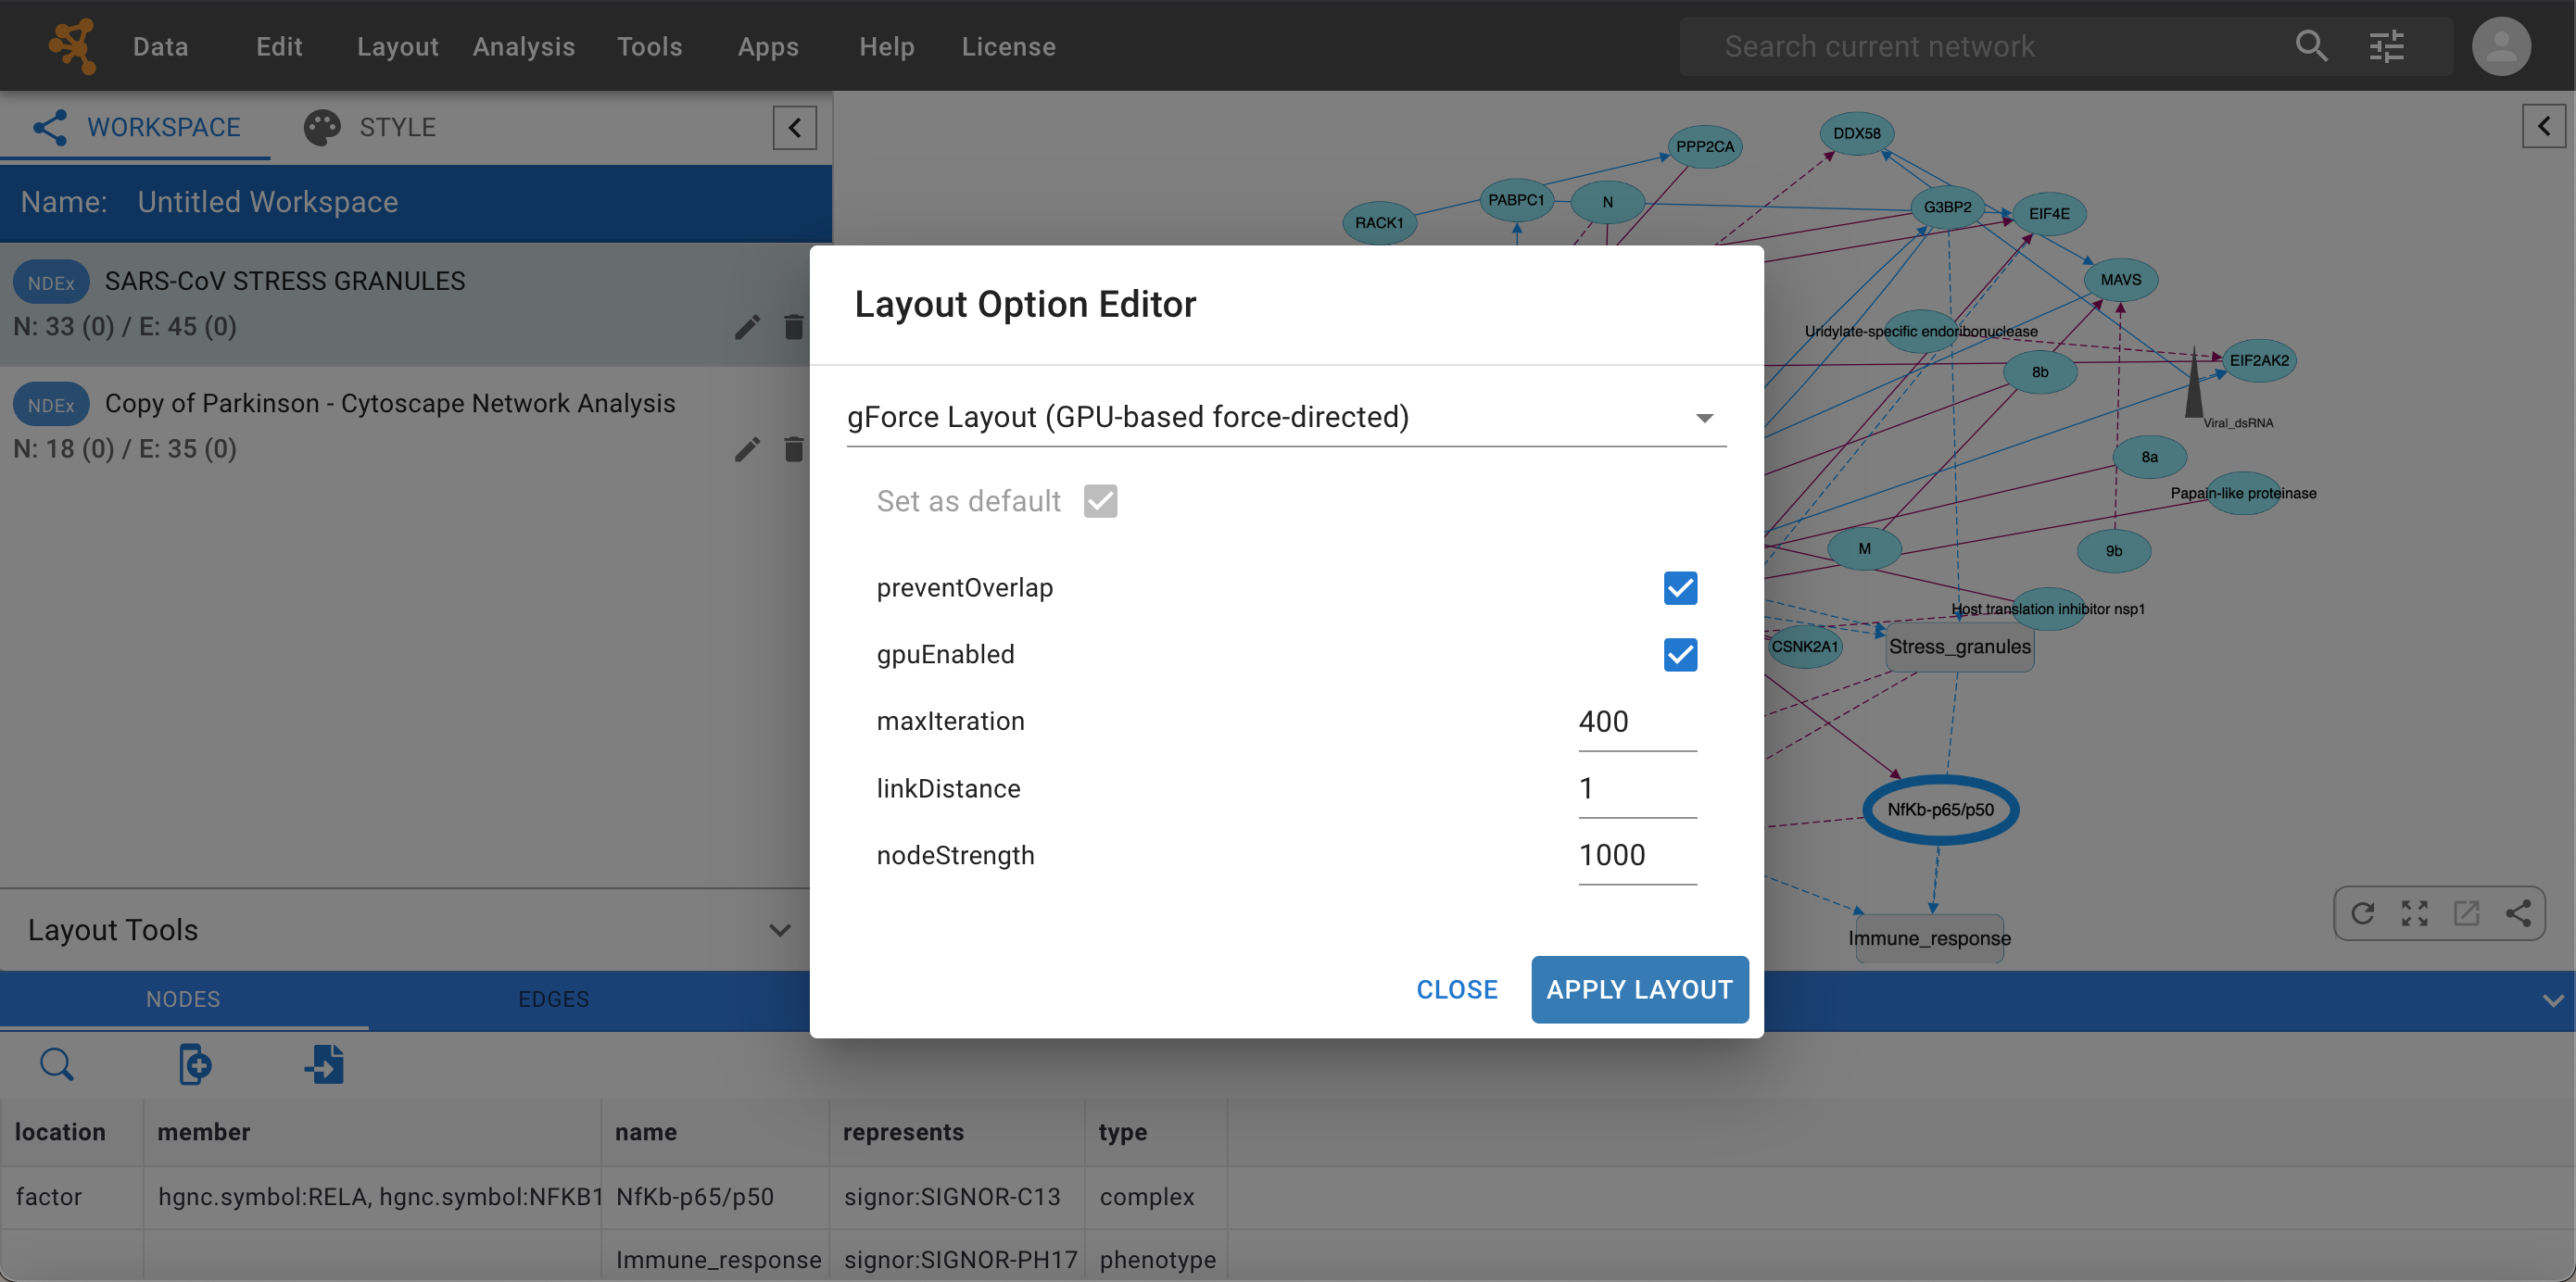
Choosing Layout → Settings… will open a dialog window where you can select any available layout algorithm using the dropdown menu, and adjust its parameters. You can also specify a default algorithm to use via the Apply Default Layout feature available in the Network View Panel.
Analysis
The Analysis menu contains features to analyze your networks.
Run LLM Query leverages Large Language Models (LLMs) to analyze a list of genes and provide details about their involvement in known biological processes. In this version of Cytoscape Web, the LLM Query analysis is only available if your network has a map-like structure where its nodes are “communities” of genes. In future releases, the analysis will be extended to standard networks too. Other analysis tools will also be added in future releases.
Choosing Analysis → LLM Query Options lets you select the Large Language Model (LLM) used for the analysis, add your own API key as well as review and choose the prompt template to use. Currently, LLMs are 2 different versions of the popular ChatGPT, produced by OpenAI. For more information about obtaining an API key, please refer to this guide.
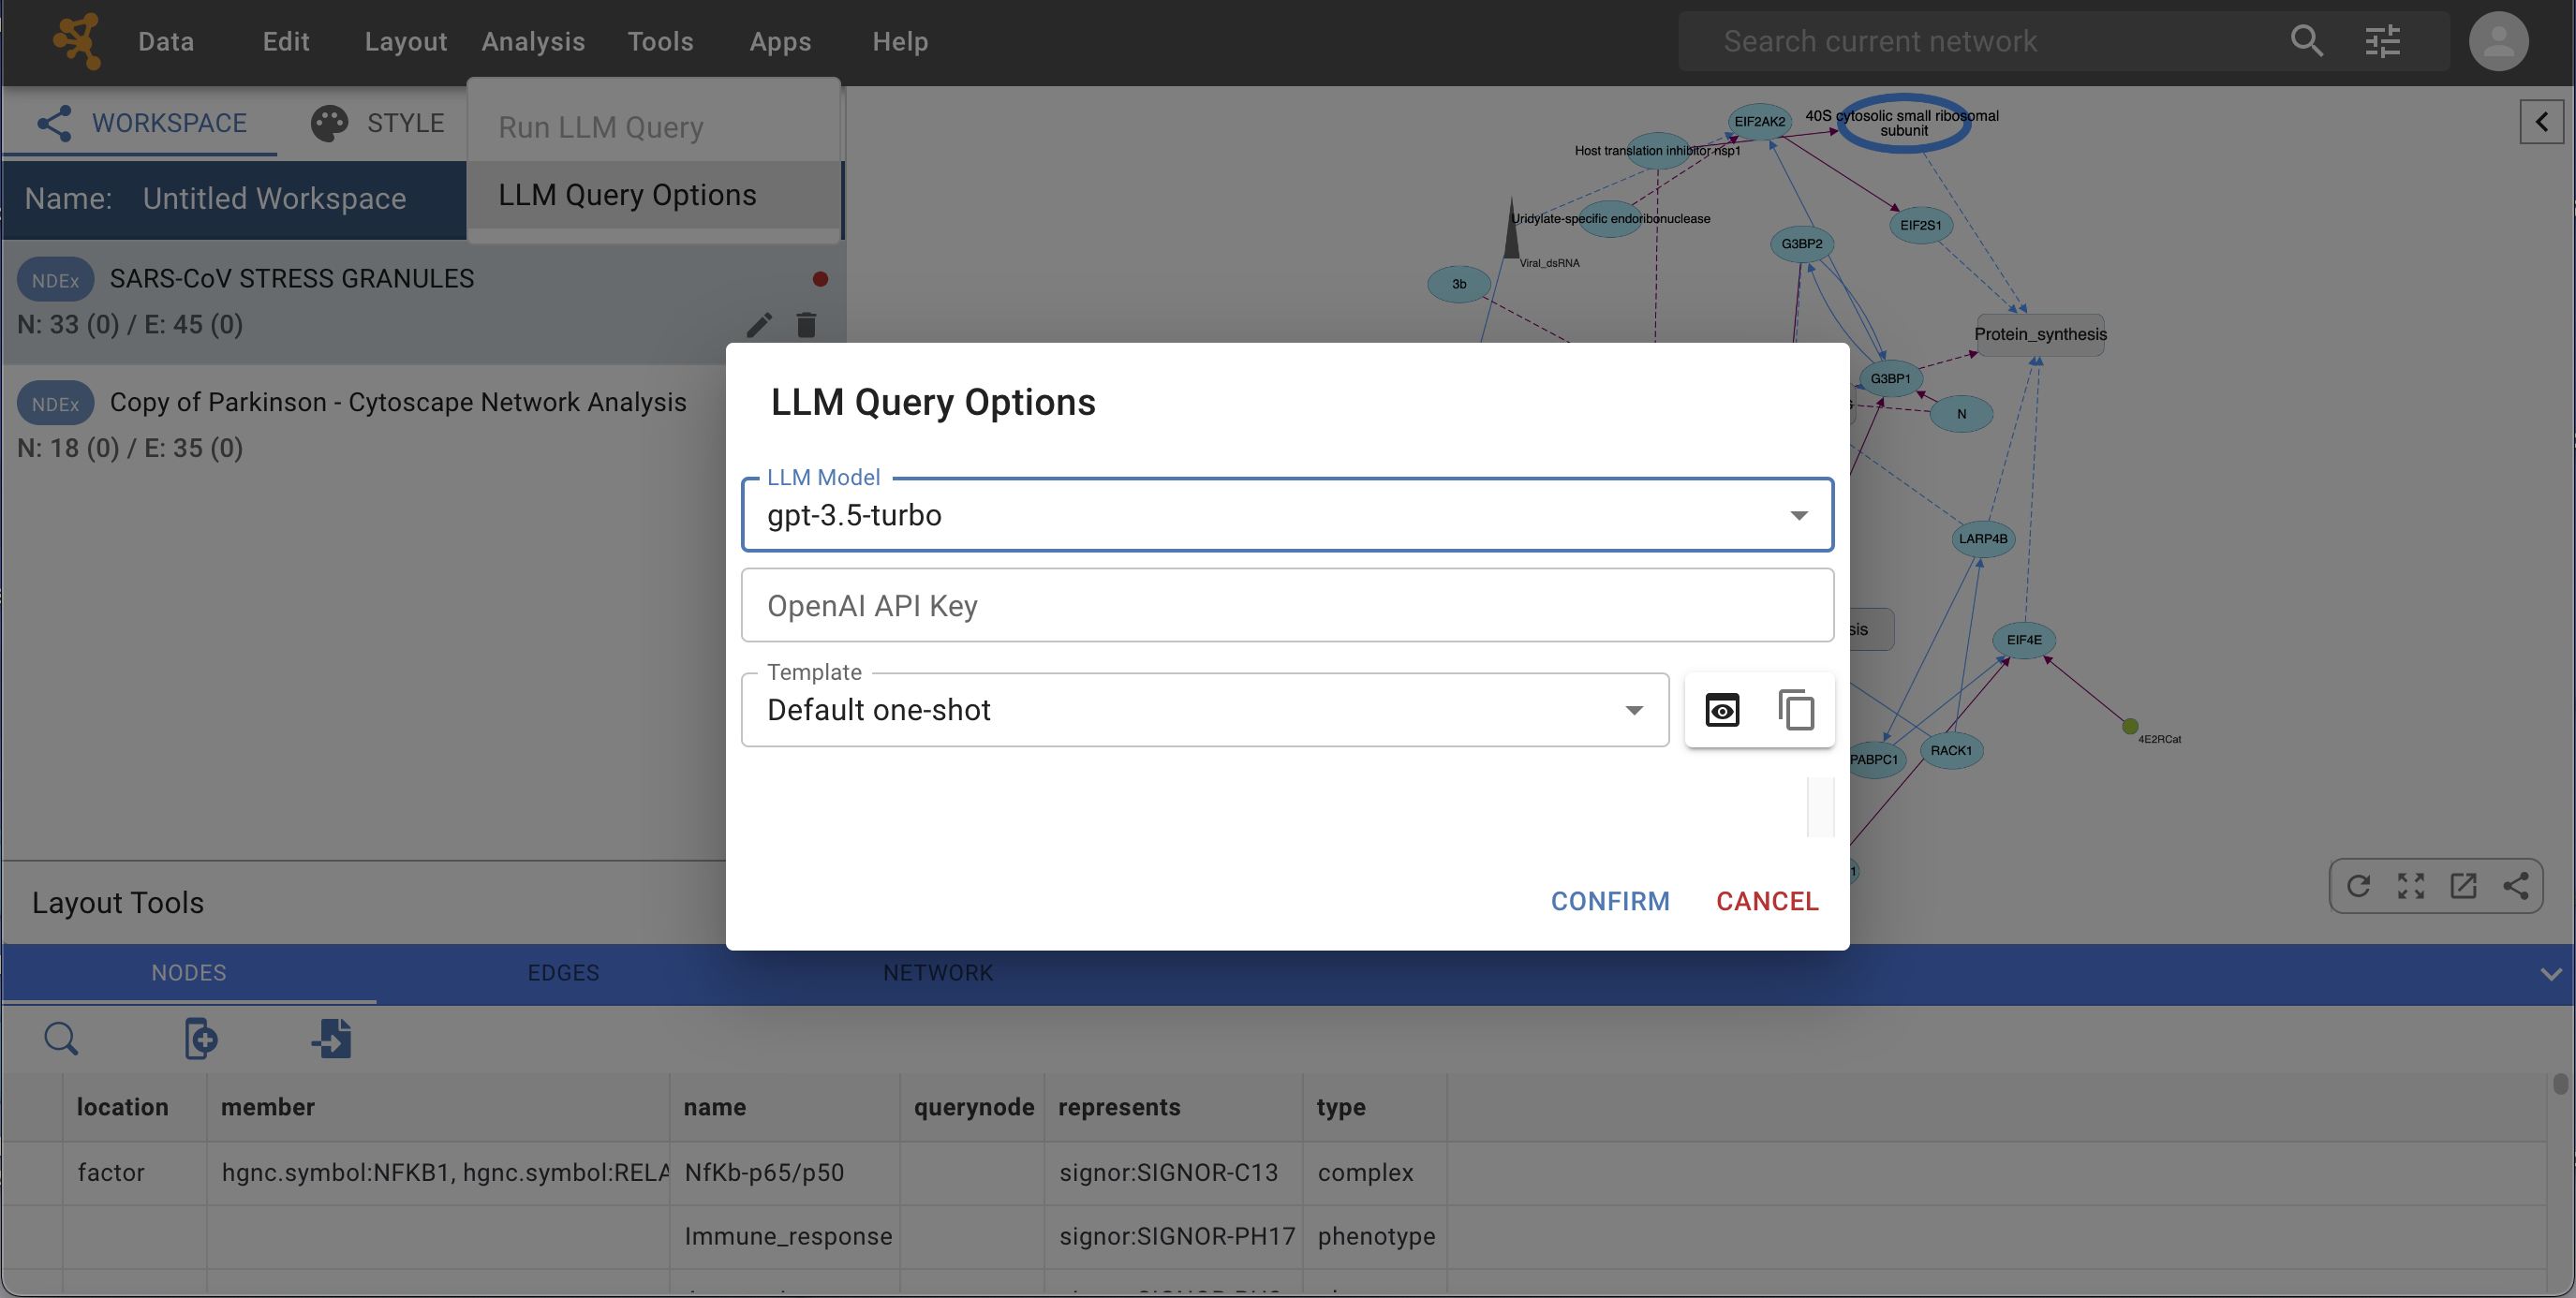
NOTE: this feature leverages commercially available LLMs and is therefore a paid feature. In order to use it, you must provide an API key linked to your OpenAI account so you can be billed based on usage. The API key is stored locally in your browser’s cache, encrypted and only transmitted to OpenAI via secure hyper text transfer protocol (https).
Tools
The Tools menu contains advanced features like Network Merge. Other advanced feature tools will be added in future releases.
Apps
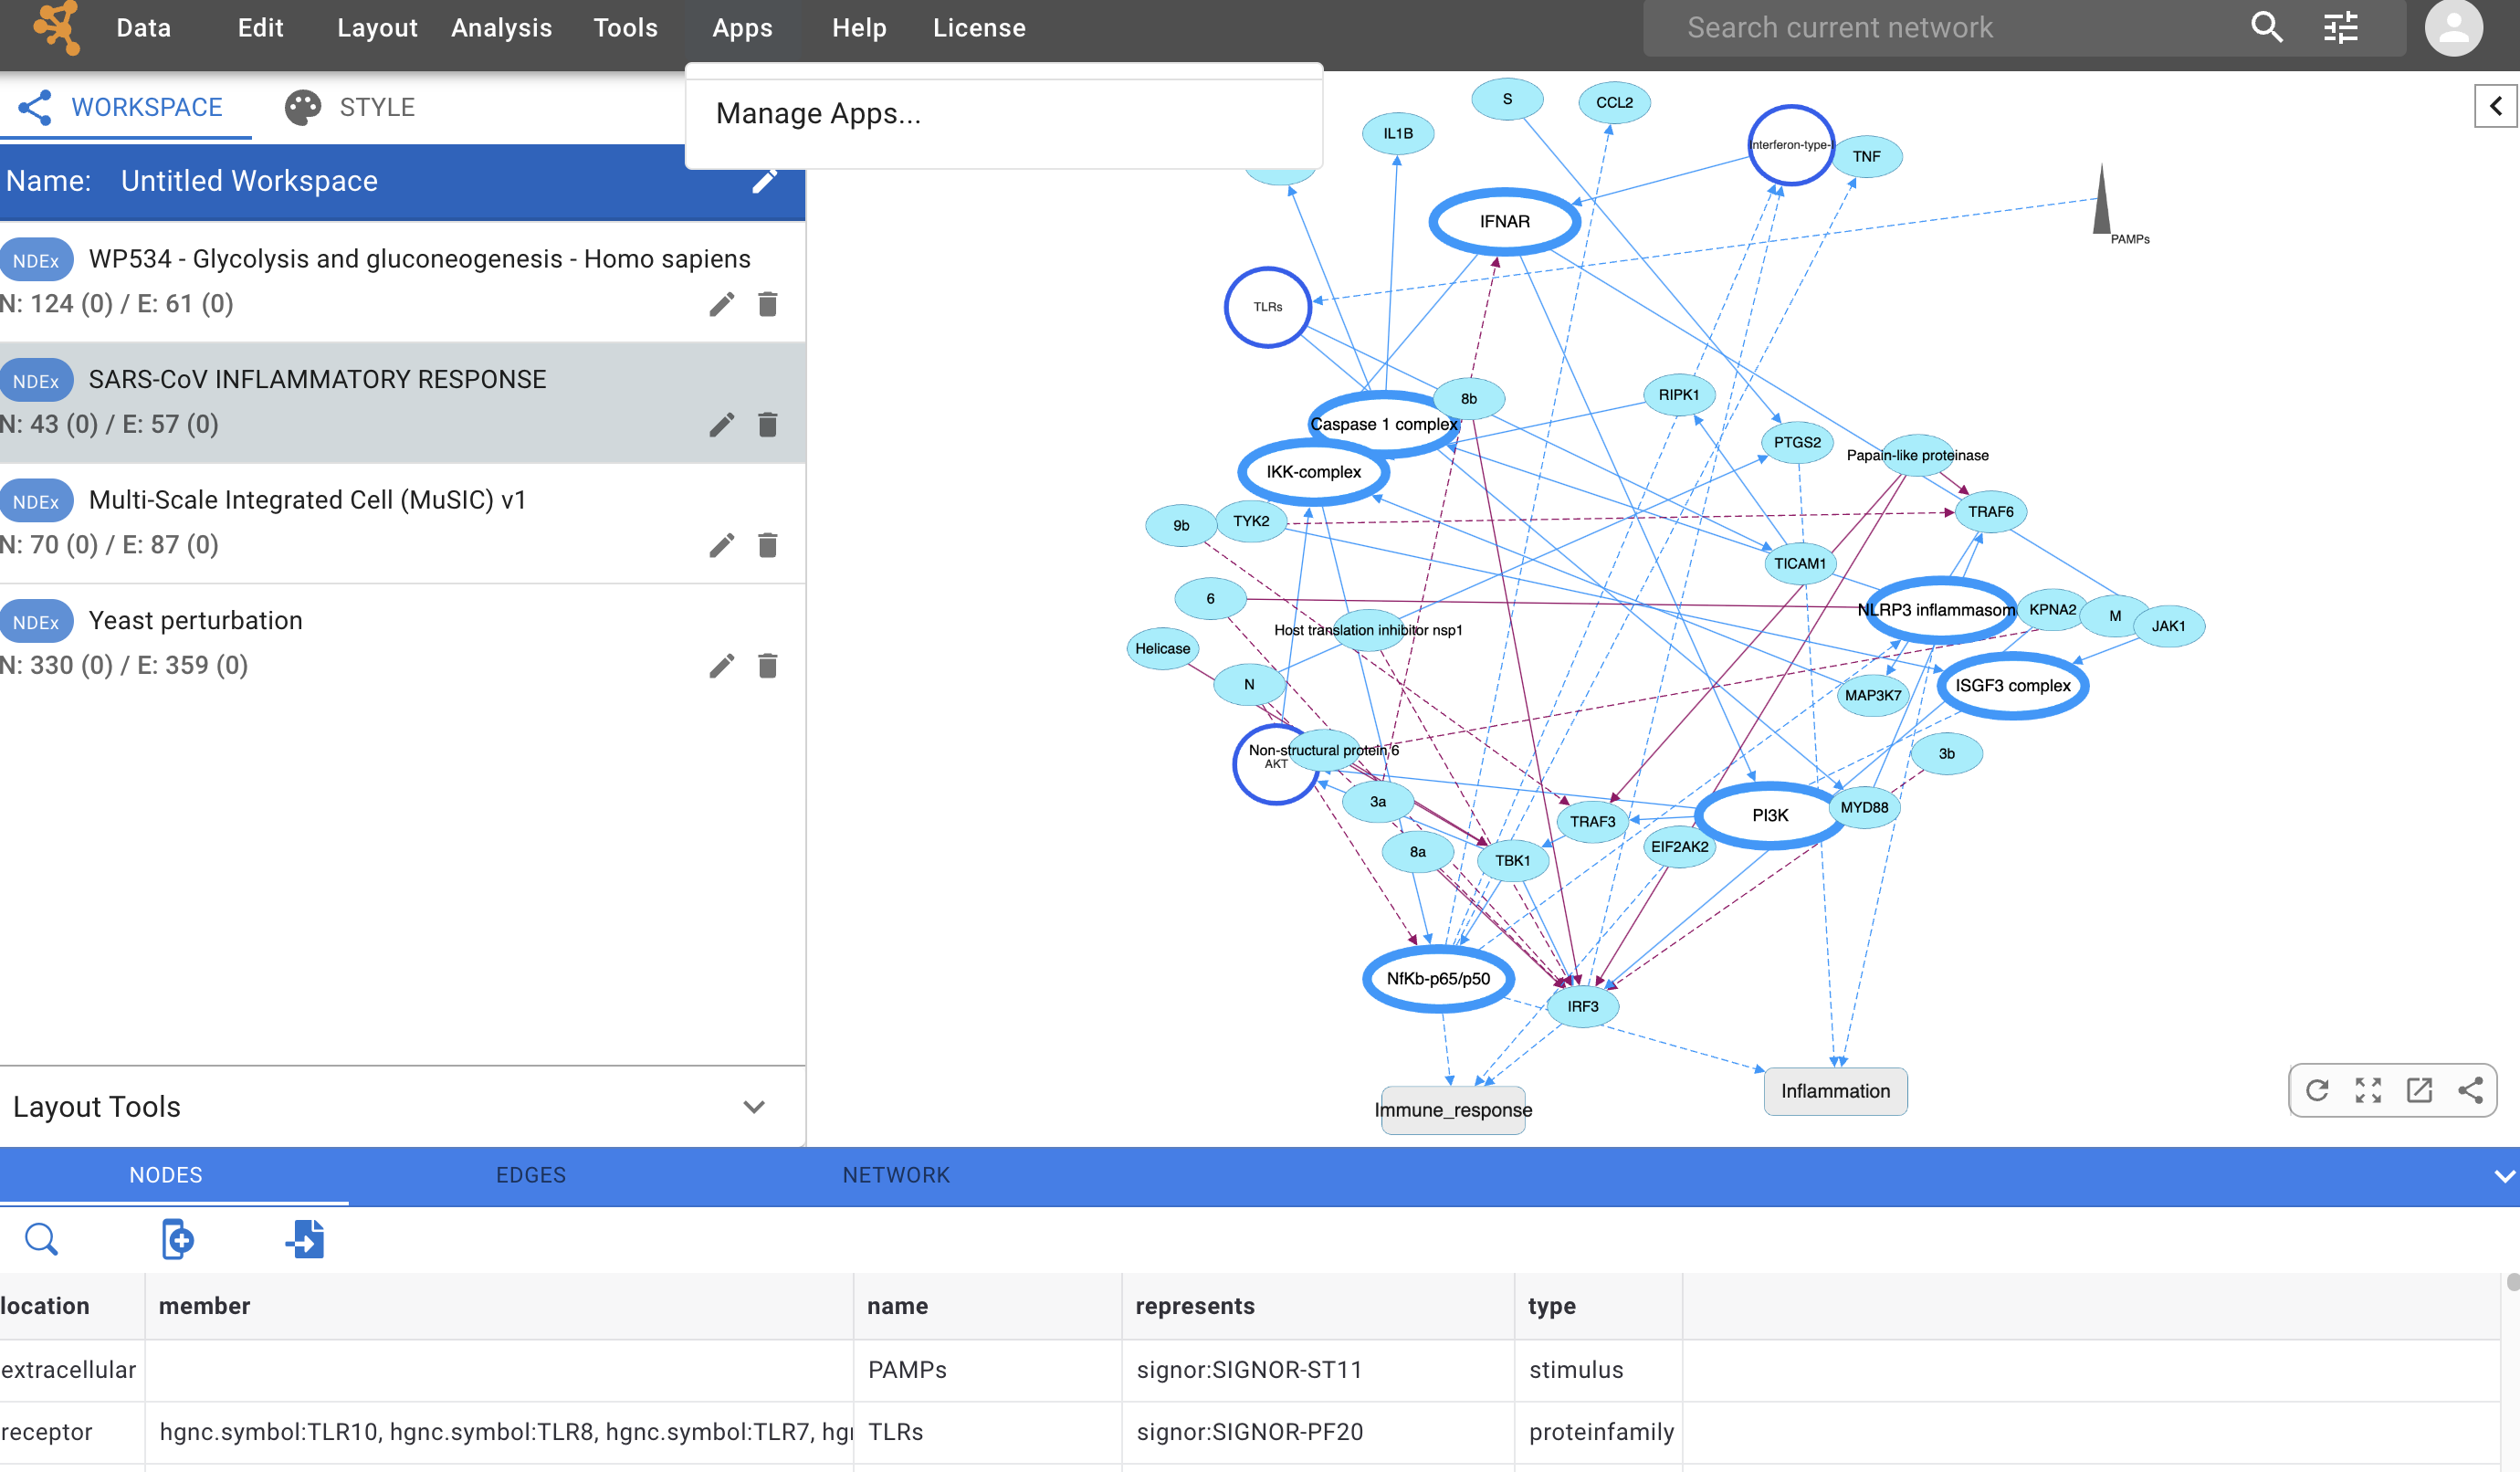
The Apps menu allows to manage and configure Apps and external Service Apps that extend Cytoscape Web capabilities. As Apps and Service Apps are developed over time, they will become available through this menu. For more information about Apps and Service Apps, please review the chapter on Extending Cytoscape Web
Help
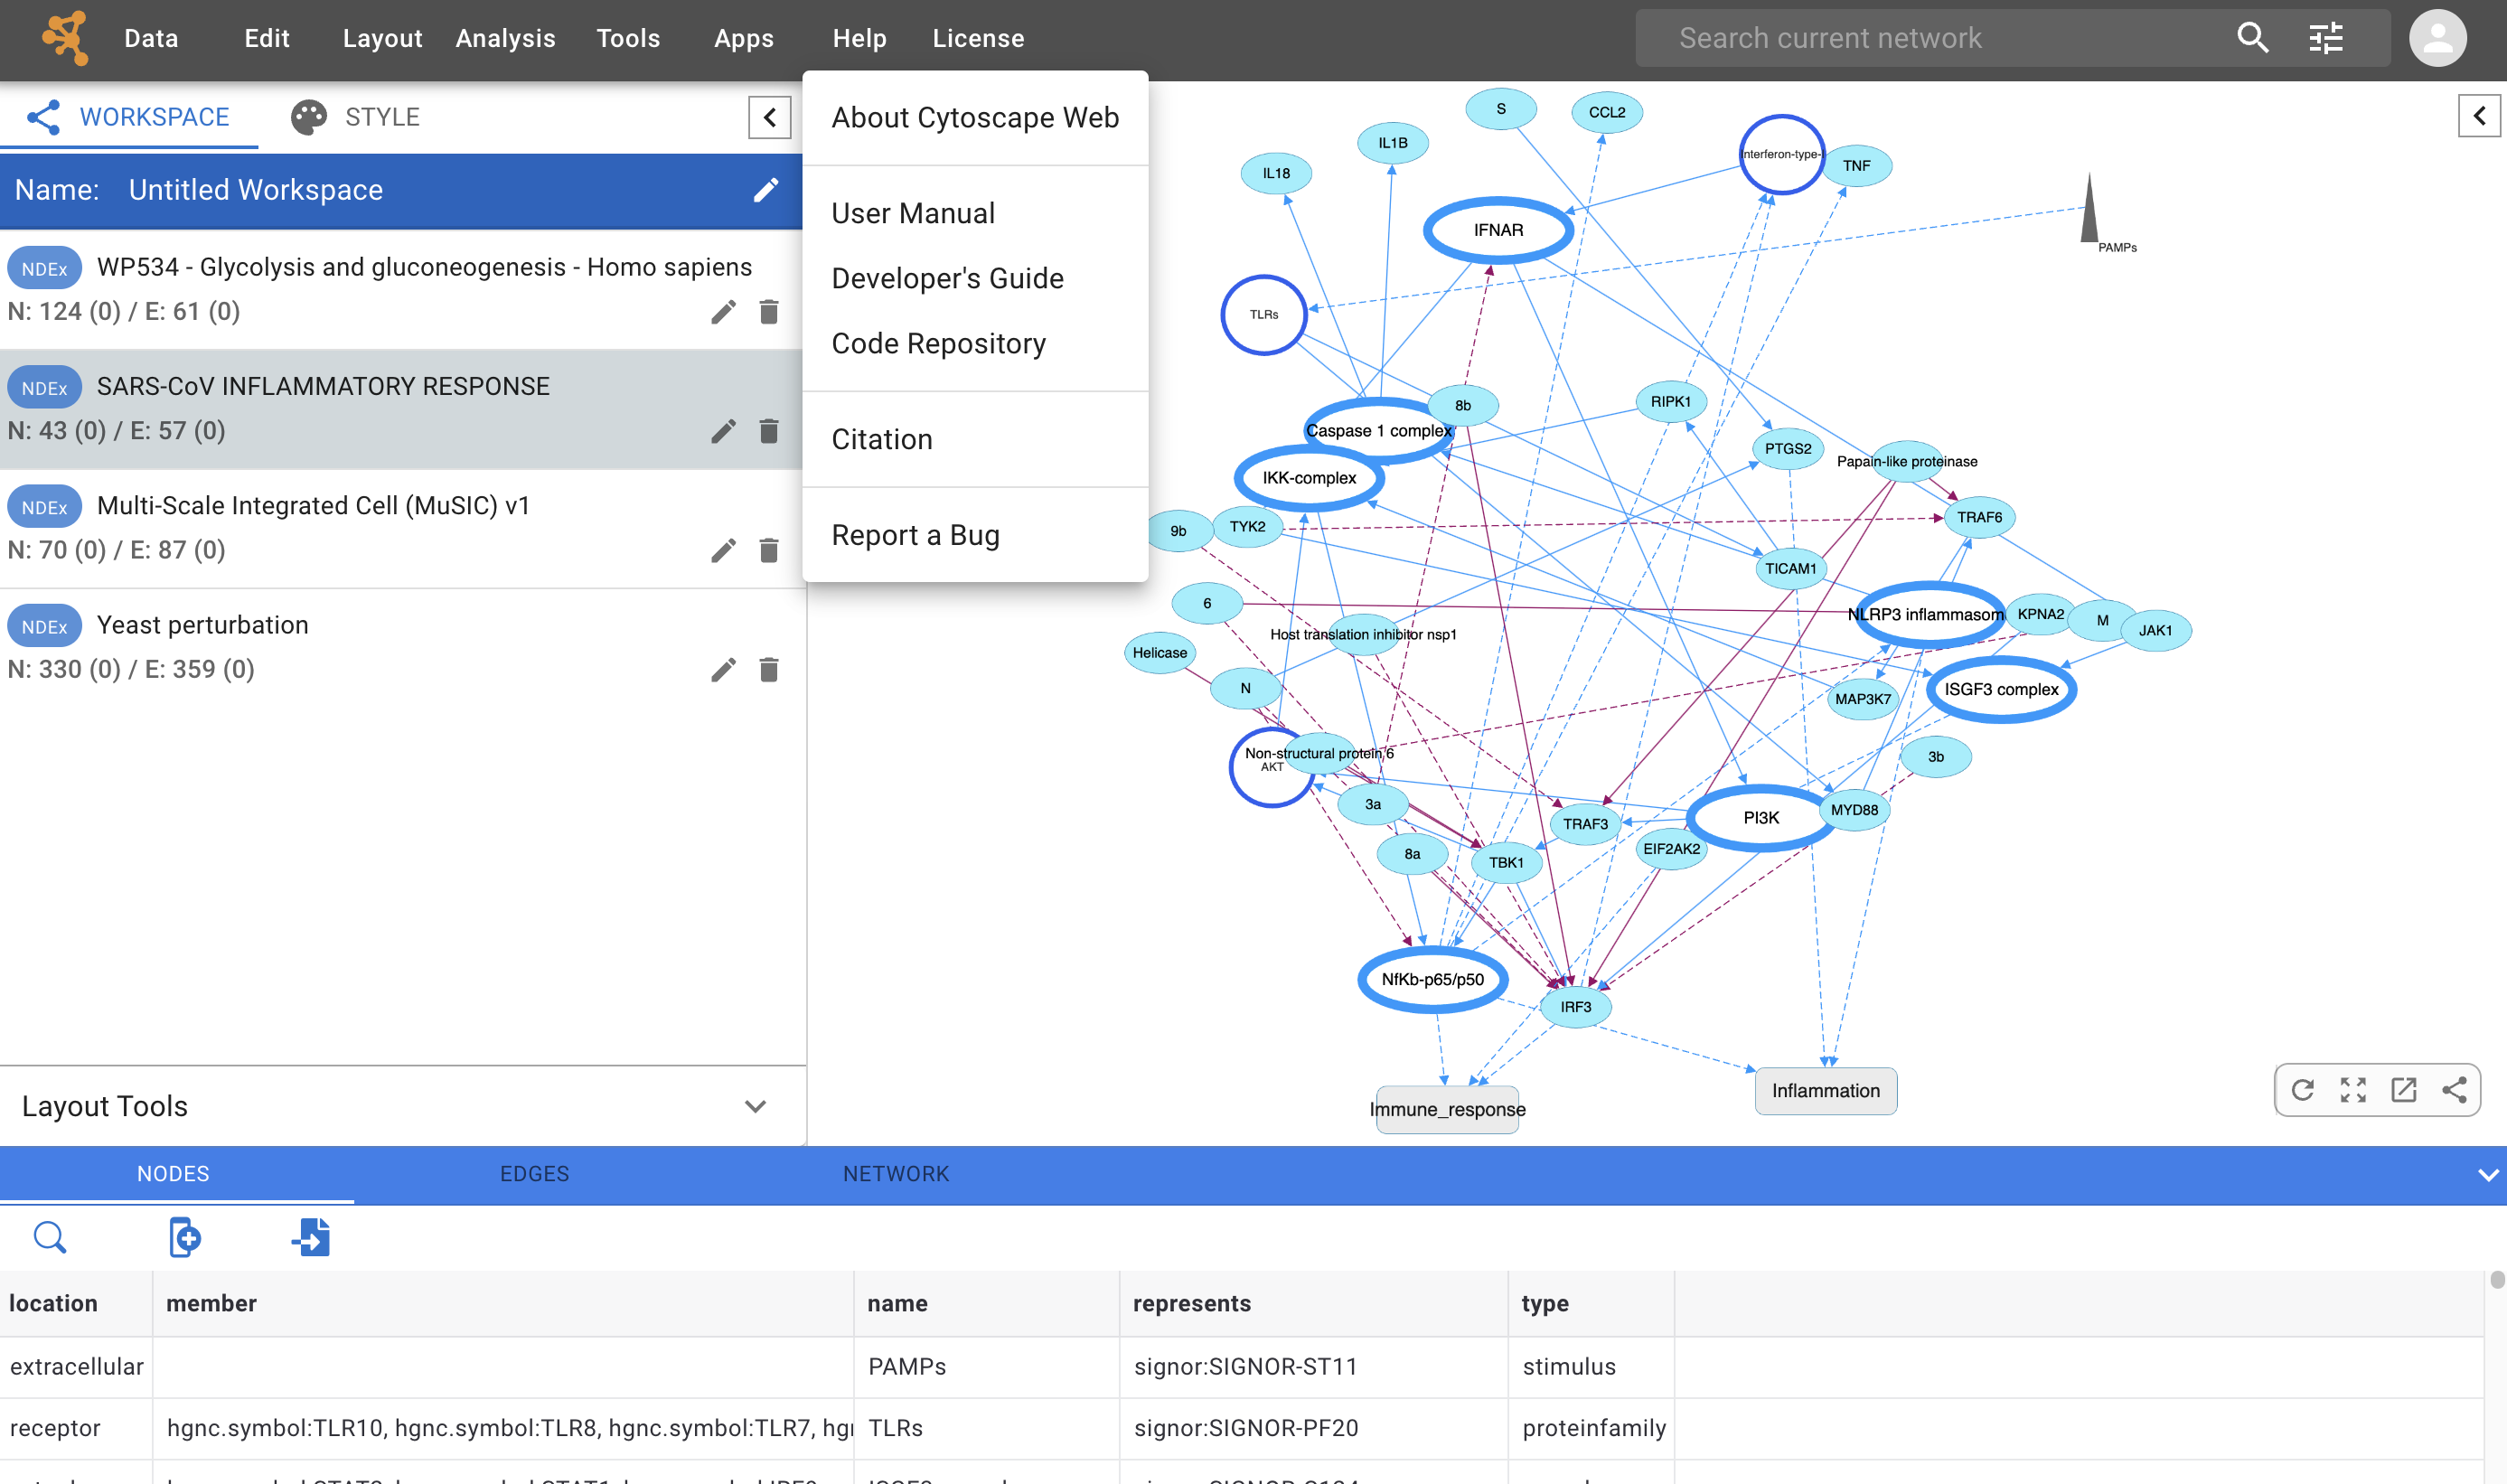
The Help menu allows you to easily access basic information About Cytoscape Web, this Manual, the Code Repository and Bug Report interface. The Citation option displays the literature citation for Cytoscape Web.
Search Tool
The Search Tool lets you find elements within your network using text-based search. Click  in the Search Tool to reveal the search settings:
As shown below, you can adjust the search settings by:
Selecting the type of boolean operator (AND or OR) to use.
Choosing the target (nodes only, edges only or both).
Selecting the search mode. The Exact Match option is used to enable/disable wildcard searches. When enabled, the results will only contain the exact search term you specified.
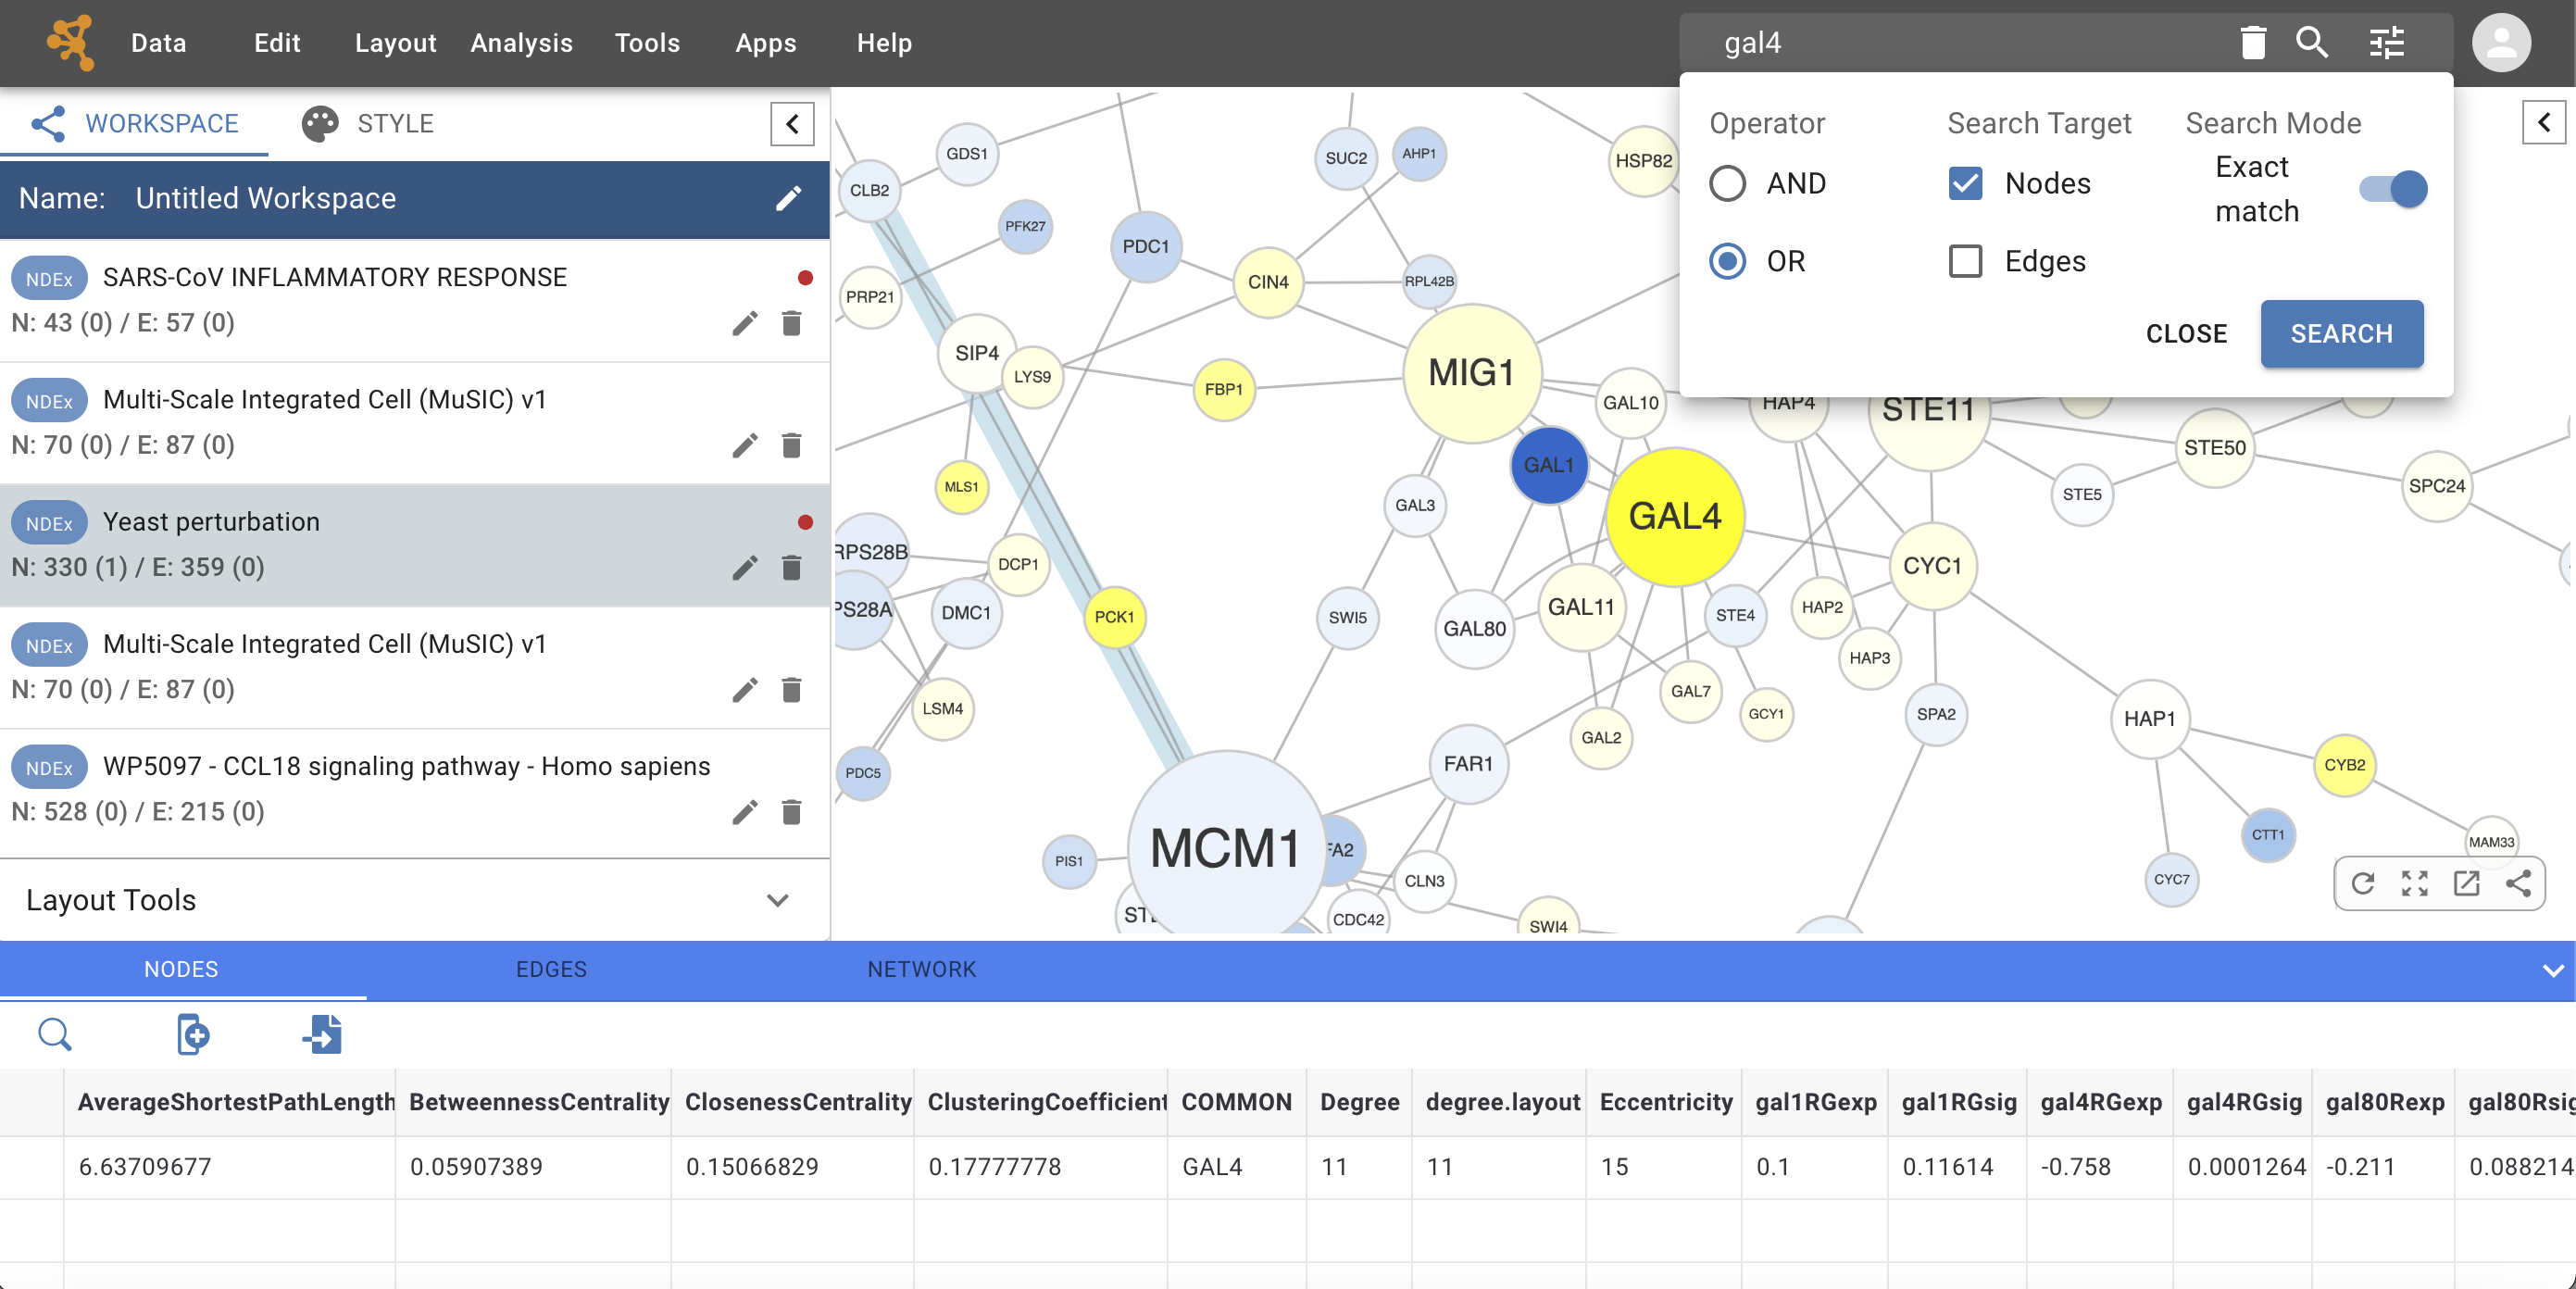
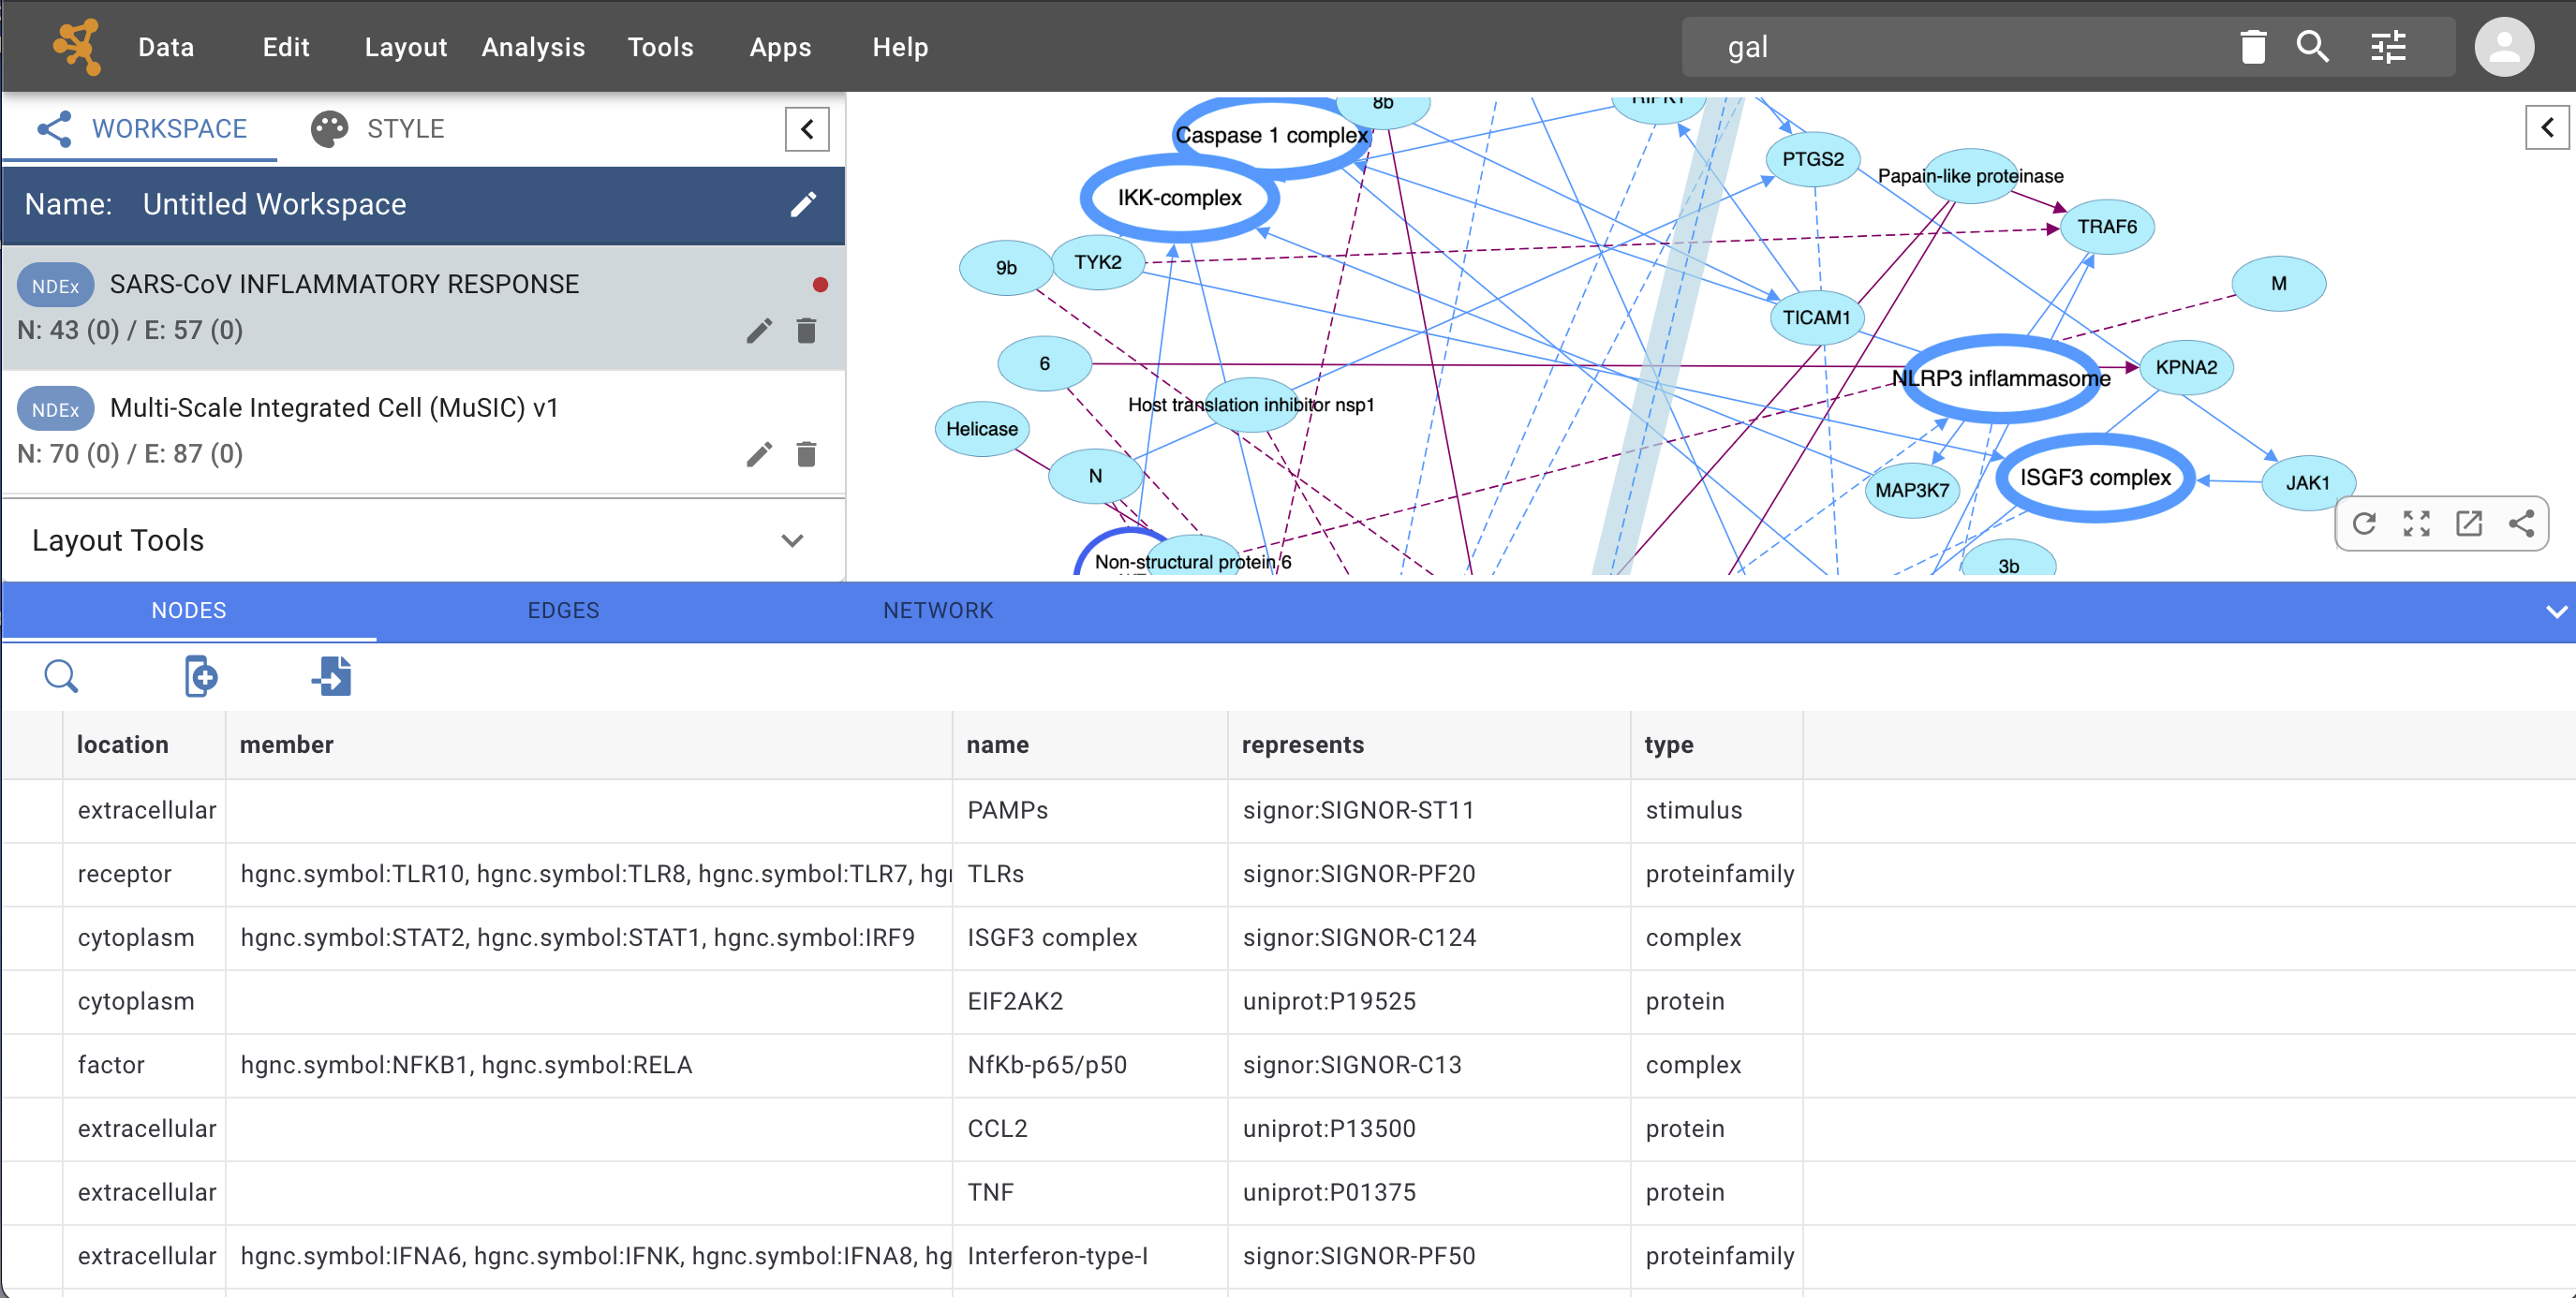
Searches are case insensitive; by default, they are performed on nodes, using the OR operator and Exact match enabled. So, in the example above:
Searching for “gal4” will find the specified node
Searching for “gal” will return no results.
If you disable Exact match:
Searching for “gal4” will find the specified node
Searching for “gal” will find all the nodes whose name contains “gal”, including Gal4.
Sign In Button
At the far right of the menu bar, the ![]() icon allows you to sign in to your Network Data Exchange (NDEx) account (if you already have one) or register for one. Your NDEx accounts acts as the official “Cytoscape Ecosystem Account”, and provides a secure, unified sign-in experience across existing and future Cytoscape ecosystem’s applications and services.
icon allows you to sign in to your Network Data Exchange (NDEx) account (if you already have one) or register for one. Your NDEx accounts acts as the official “Cytoscape Ecosystem Account”, and provides a secure, unified sign-in experience across existing and future Cytoscape ecosystem’s applications and services.
Click ![]() and the browser will open a new tab to display the NDEx sign in page as shown below:
and the browser will open a new tab to display the NDEx sign in page as shown below:
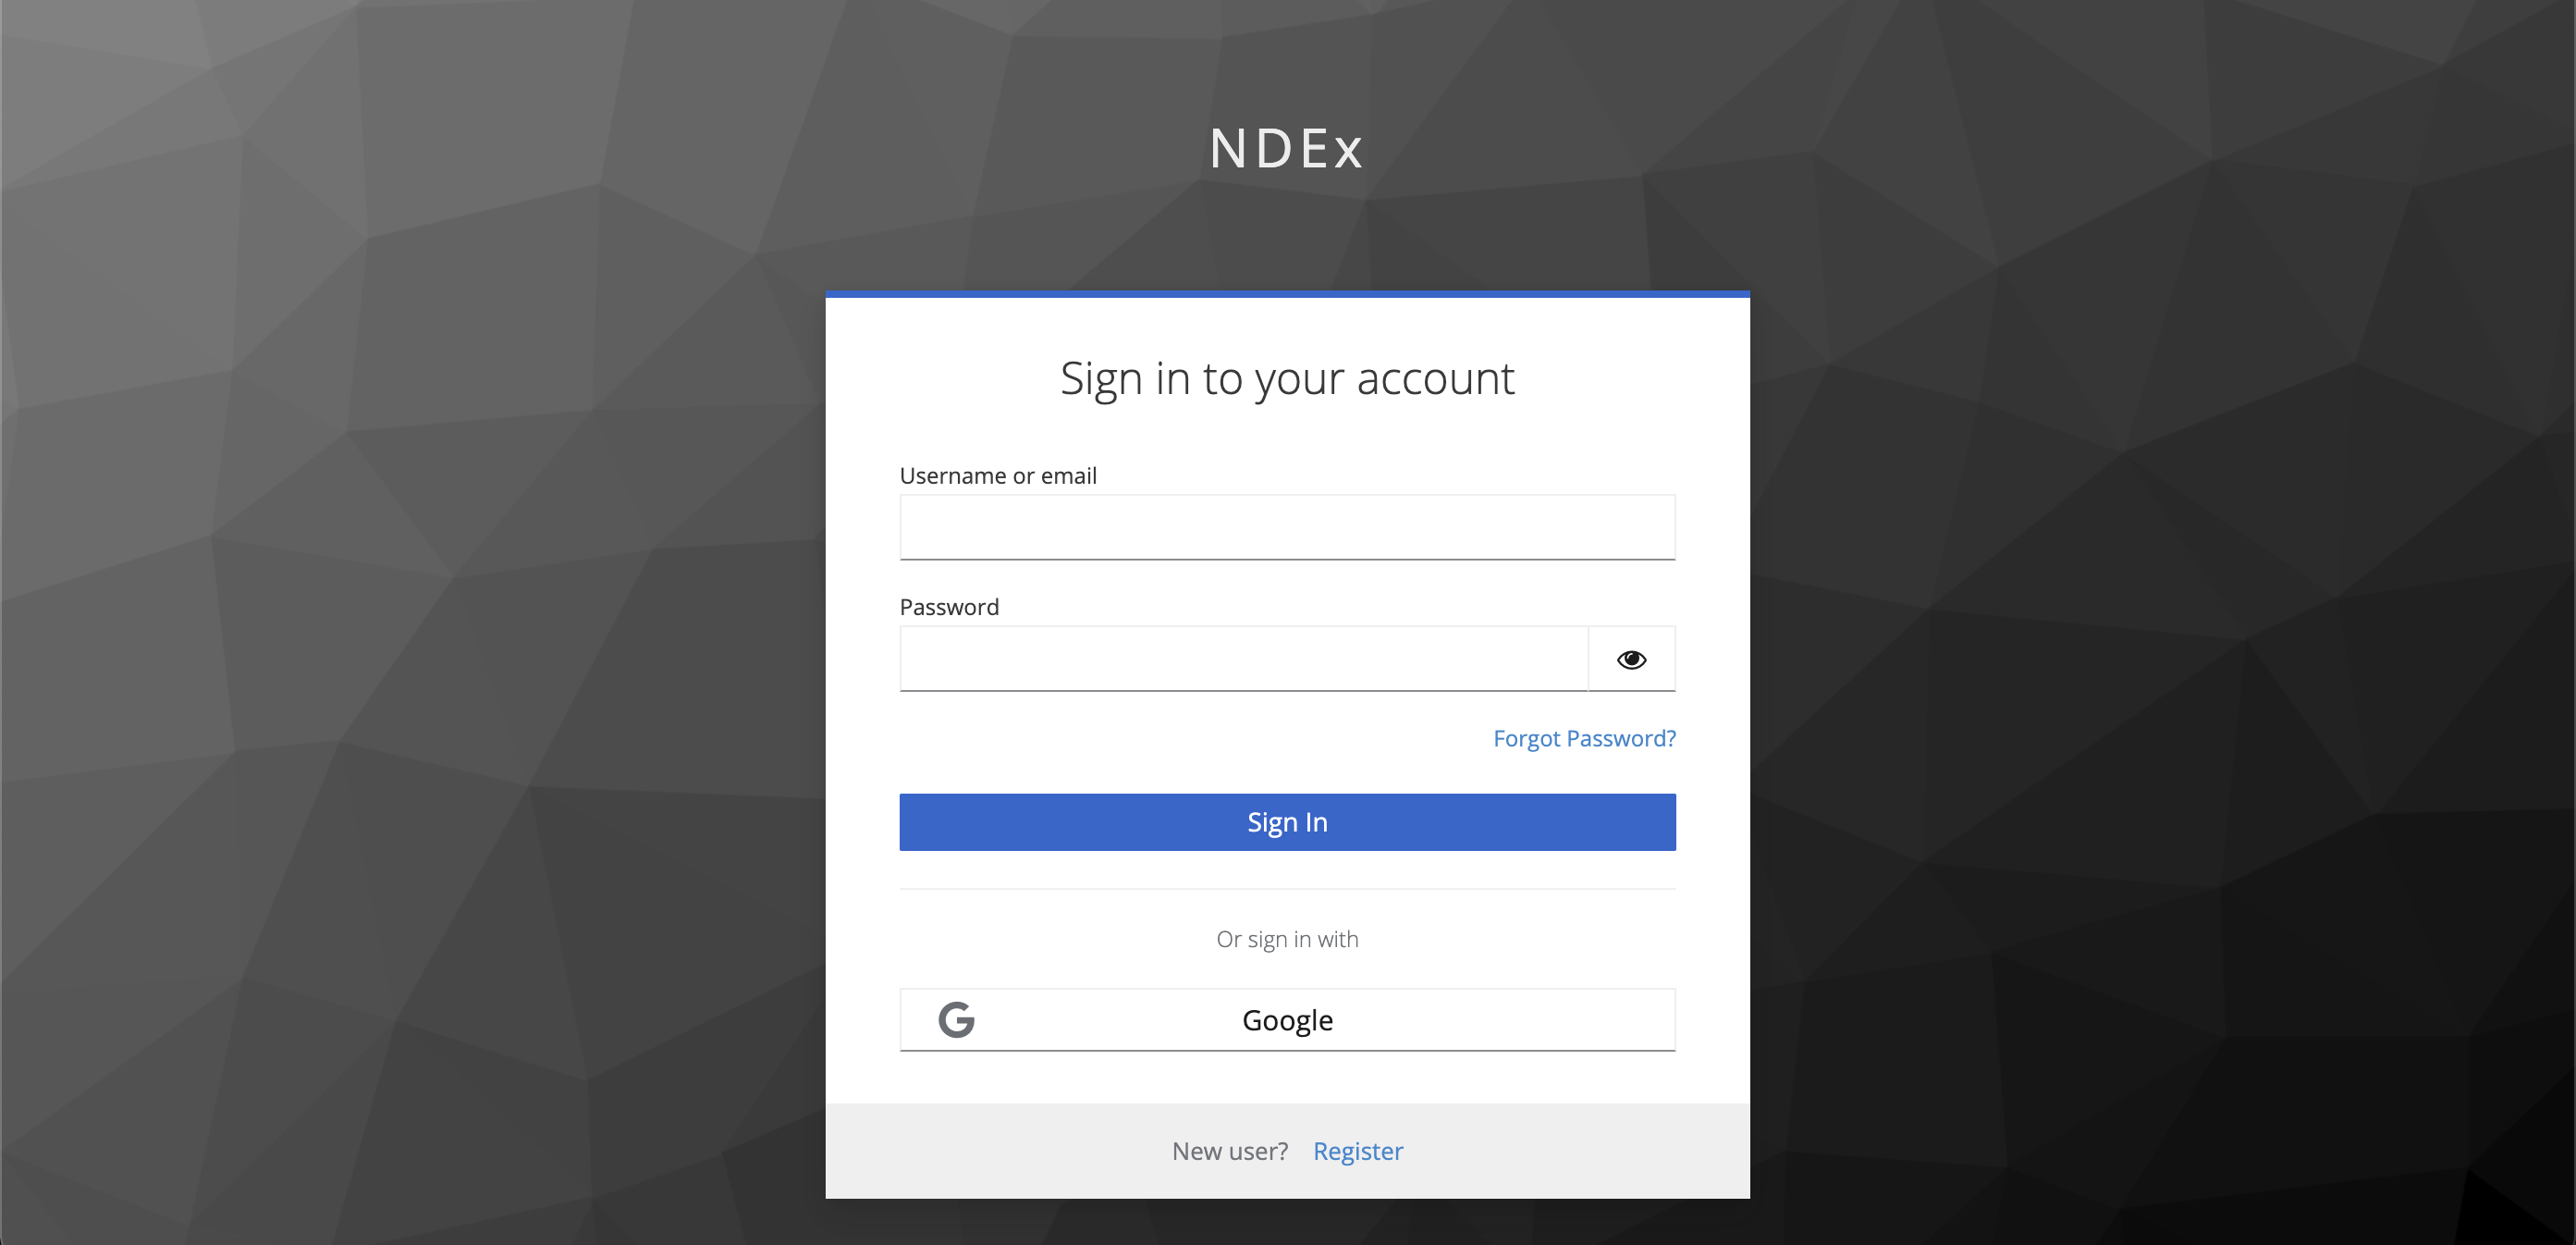
Here, you can:
Sign in to your existing NDEx account either by typing your username and password, or by using the convenient Sign In with Google option.
Create a new NDEx account. Again, the easiest/fastest way is to choose Sign In with Google to create a new account with just a few clicks. Alternatively, you can choose Register at the bottom of the screen, provide the required information and follow the instructions to activate your new NDEx account.
NOTE: even if you already have an exixting NDEx account, the first time you sign in to link your NDEx account with Cytoscape Web, you will need to go through an email verification process. While this is a quick and simple procedure, it is recommended that you perform it using the same browser and device.
2.2. Network Management
Workspace
In Cytoscape Web, the Workspace replaces the Session concept that Cytoscape desktop application users are familiar with. The Cytoscape Web Workspace allows multiple networks to be loaded, but only one can be displayed at any given time.
An example where a number of networks have been loaded is shown below:
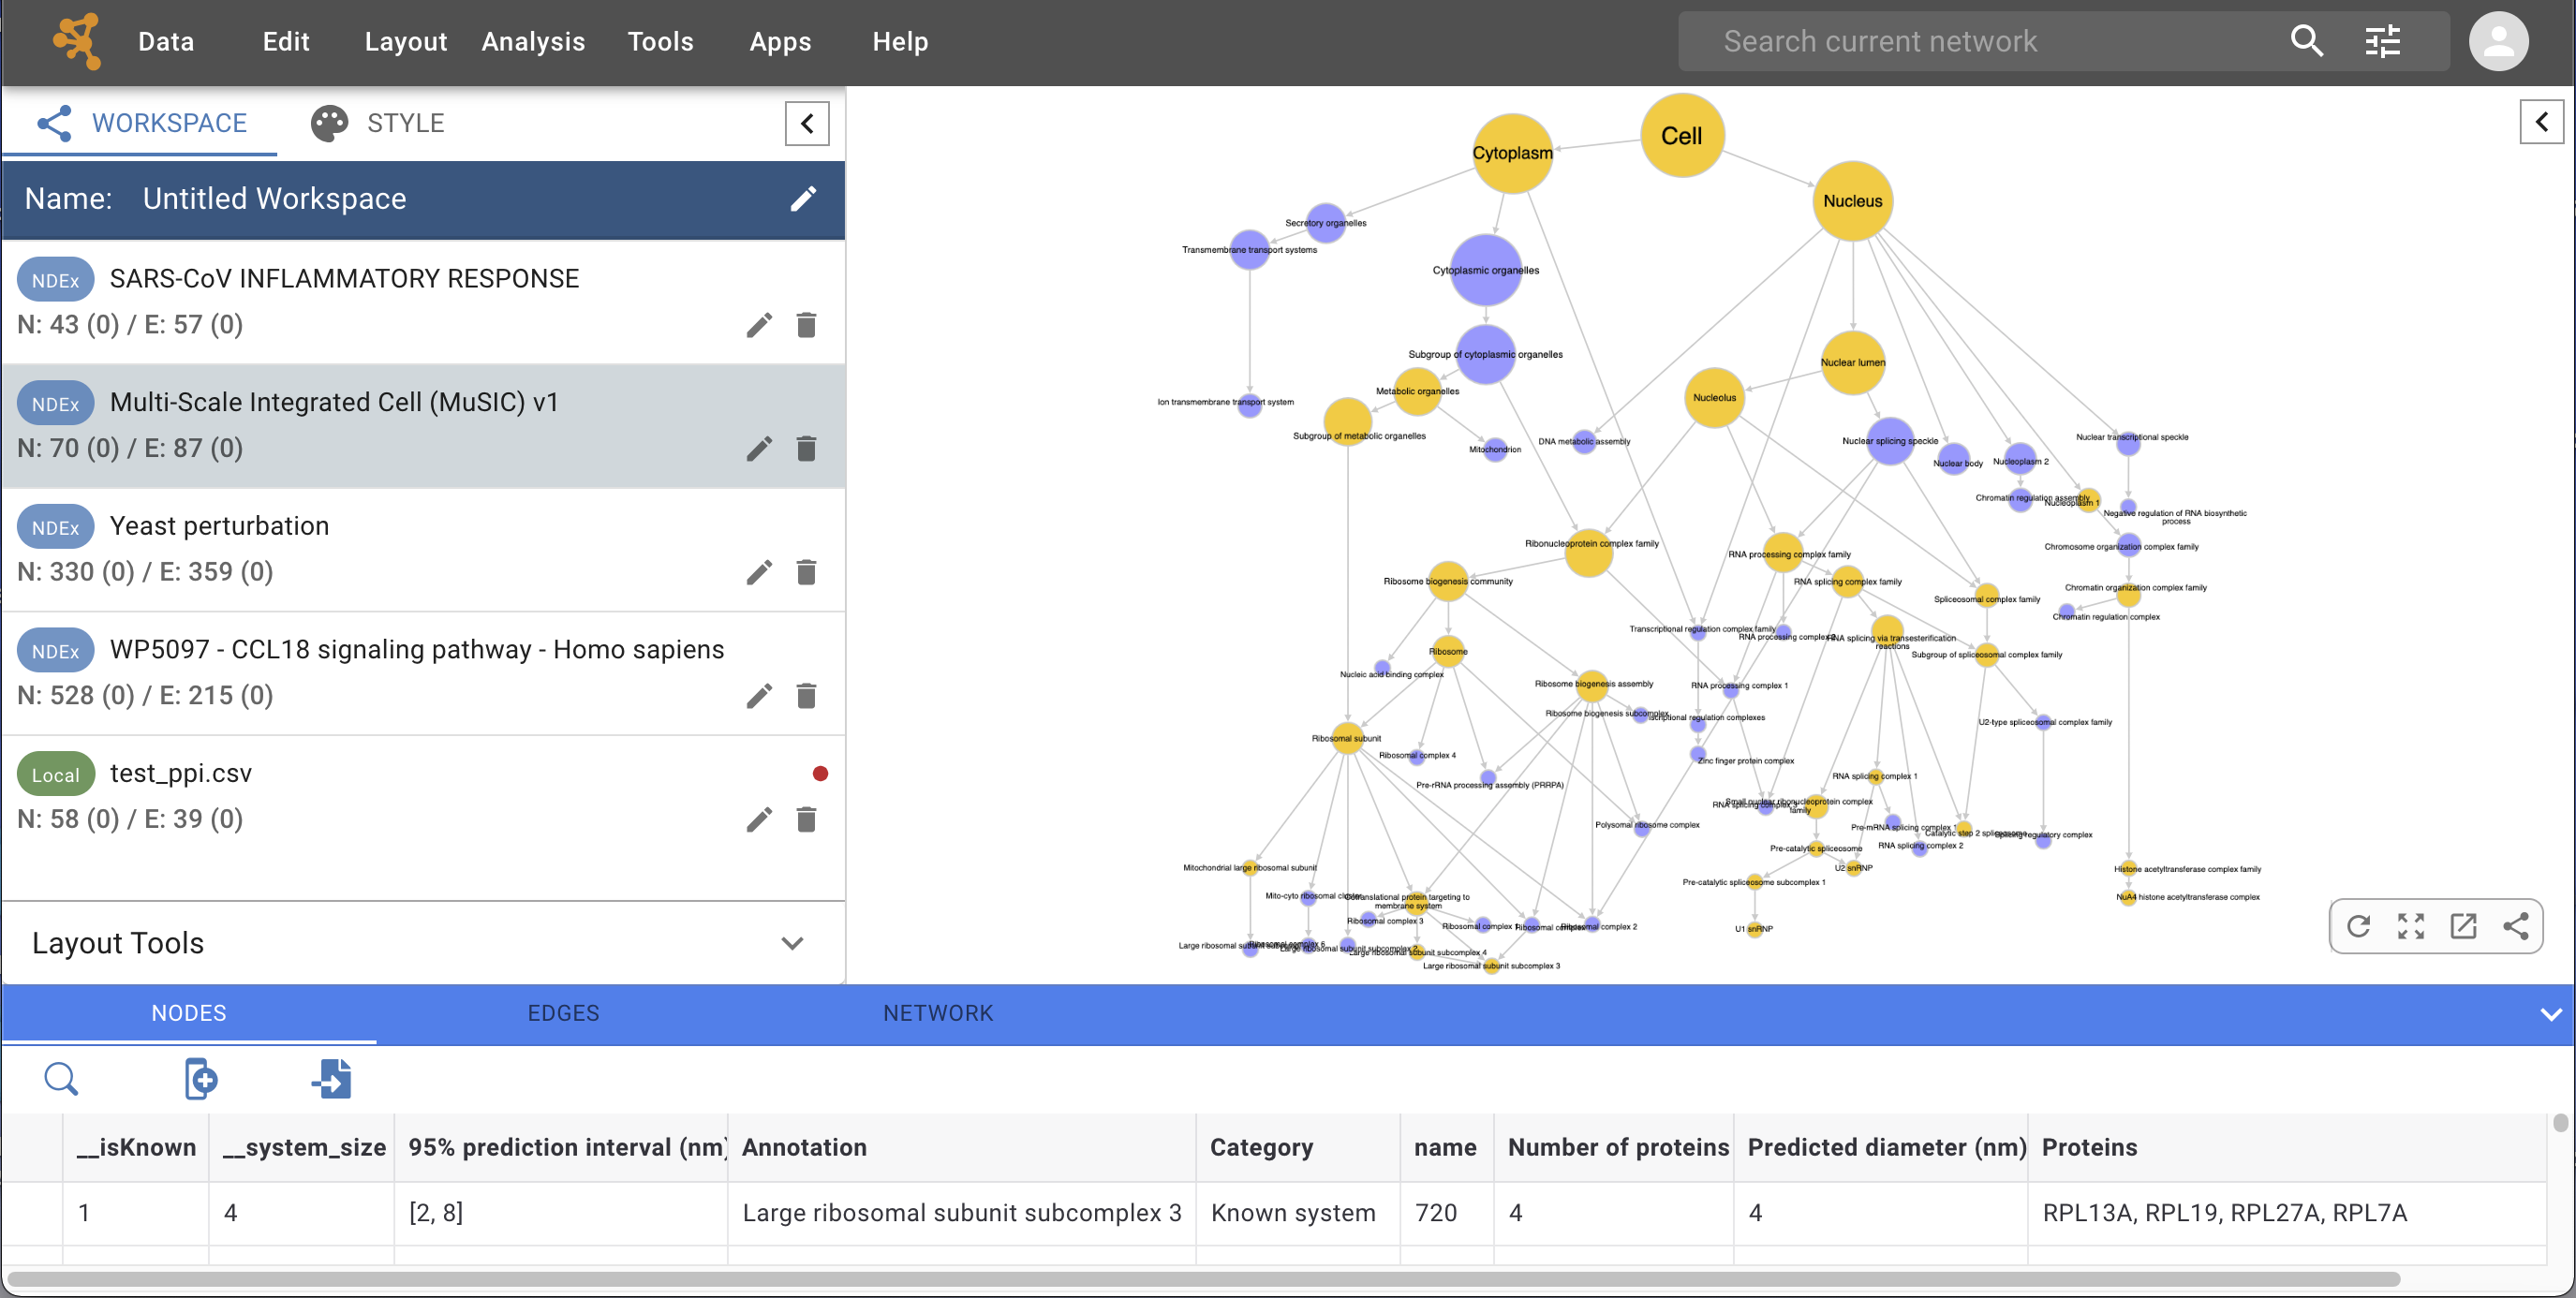
The Workspace Panel (WORKSPACE tab in Control Panel) shows all the networks that are loaded. Clicking on a network here will dispay the network in the Network View Panel. Each network has a name, size (number of nodes and edges) and a label that identifies its provenance.
If a network is loaded from NDEx, a  label is displayed in front of its name.
If the network is loaded from a file, the network name is the name of the file and a
label is displayed in front of its name.
If the network is loaded from a file, the network name is the name of the file and a  label is displayed instead.
Some networks are very large and cannot be loaded in Cytoscape Web due to limitations in web browser’s performance and capabilities:
For NDEx networks, the network size must be less than 500 Mb and/or the nodes and edges count less than 20,000 elements.
For networks imported from file, the text file must be less than 5 Mb.
A Workspace can be saved to NDEx and re-opened later, via the options available in the Data menu. For more information, please review the chapter on Creating and Saving Networks.
Style
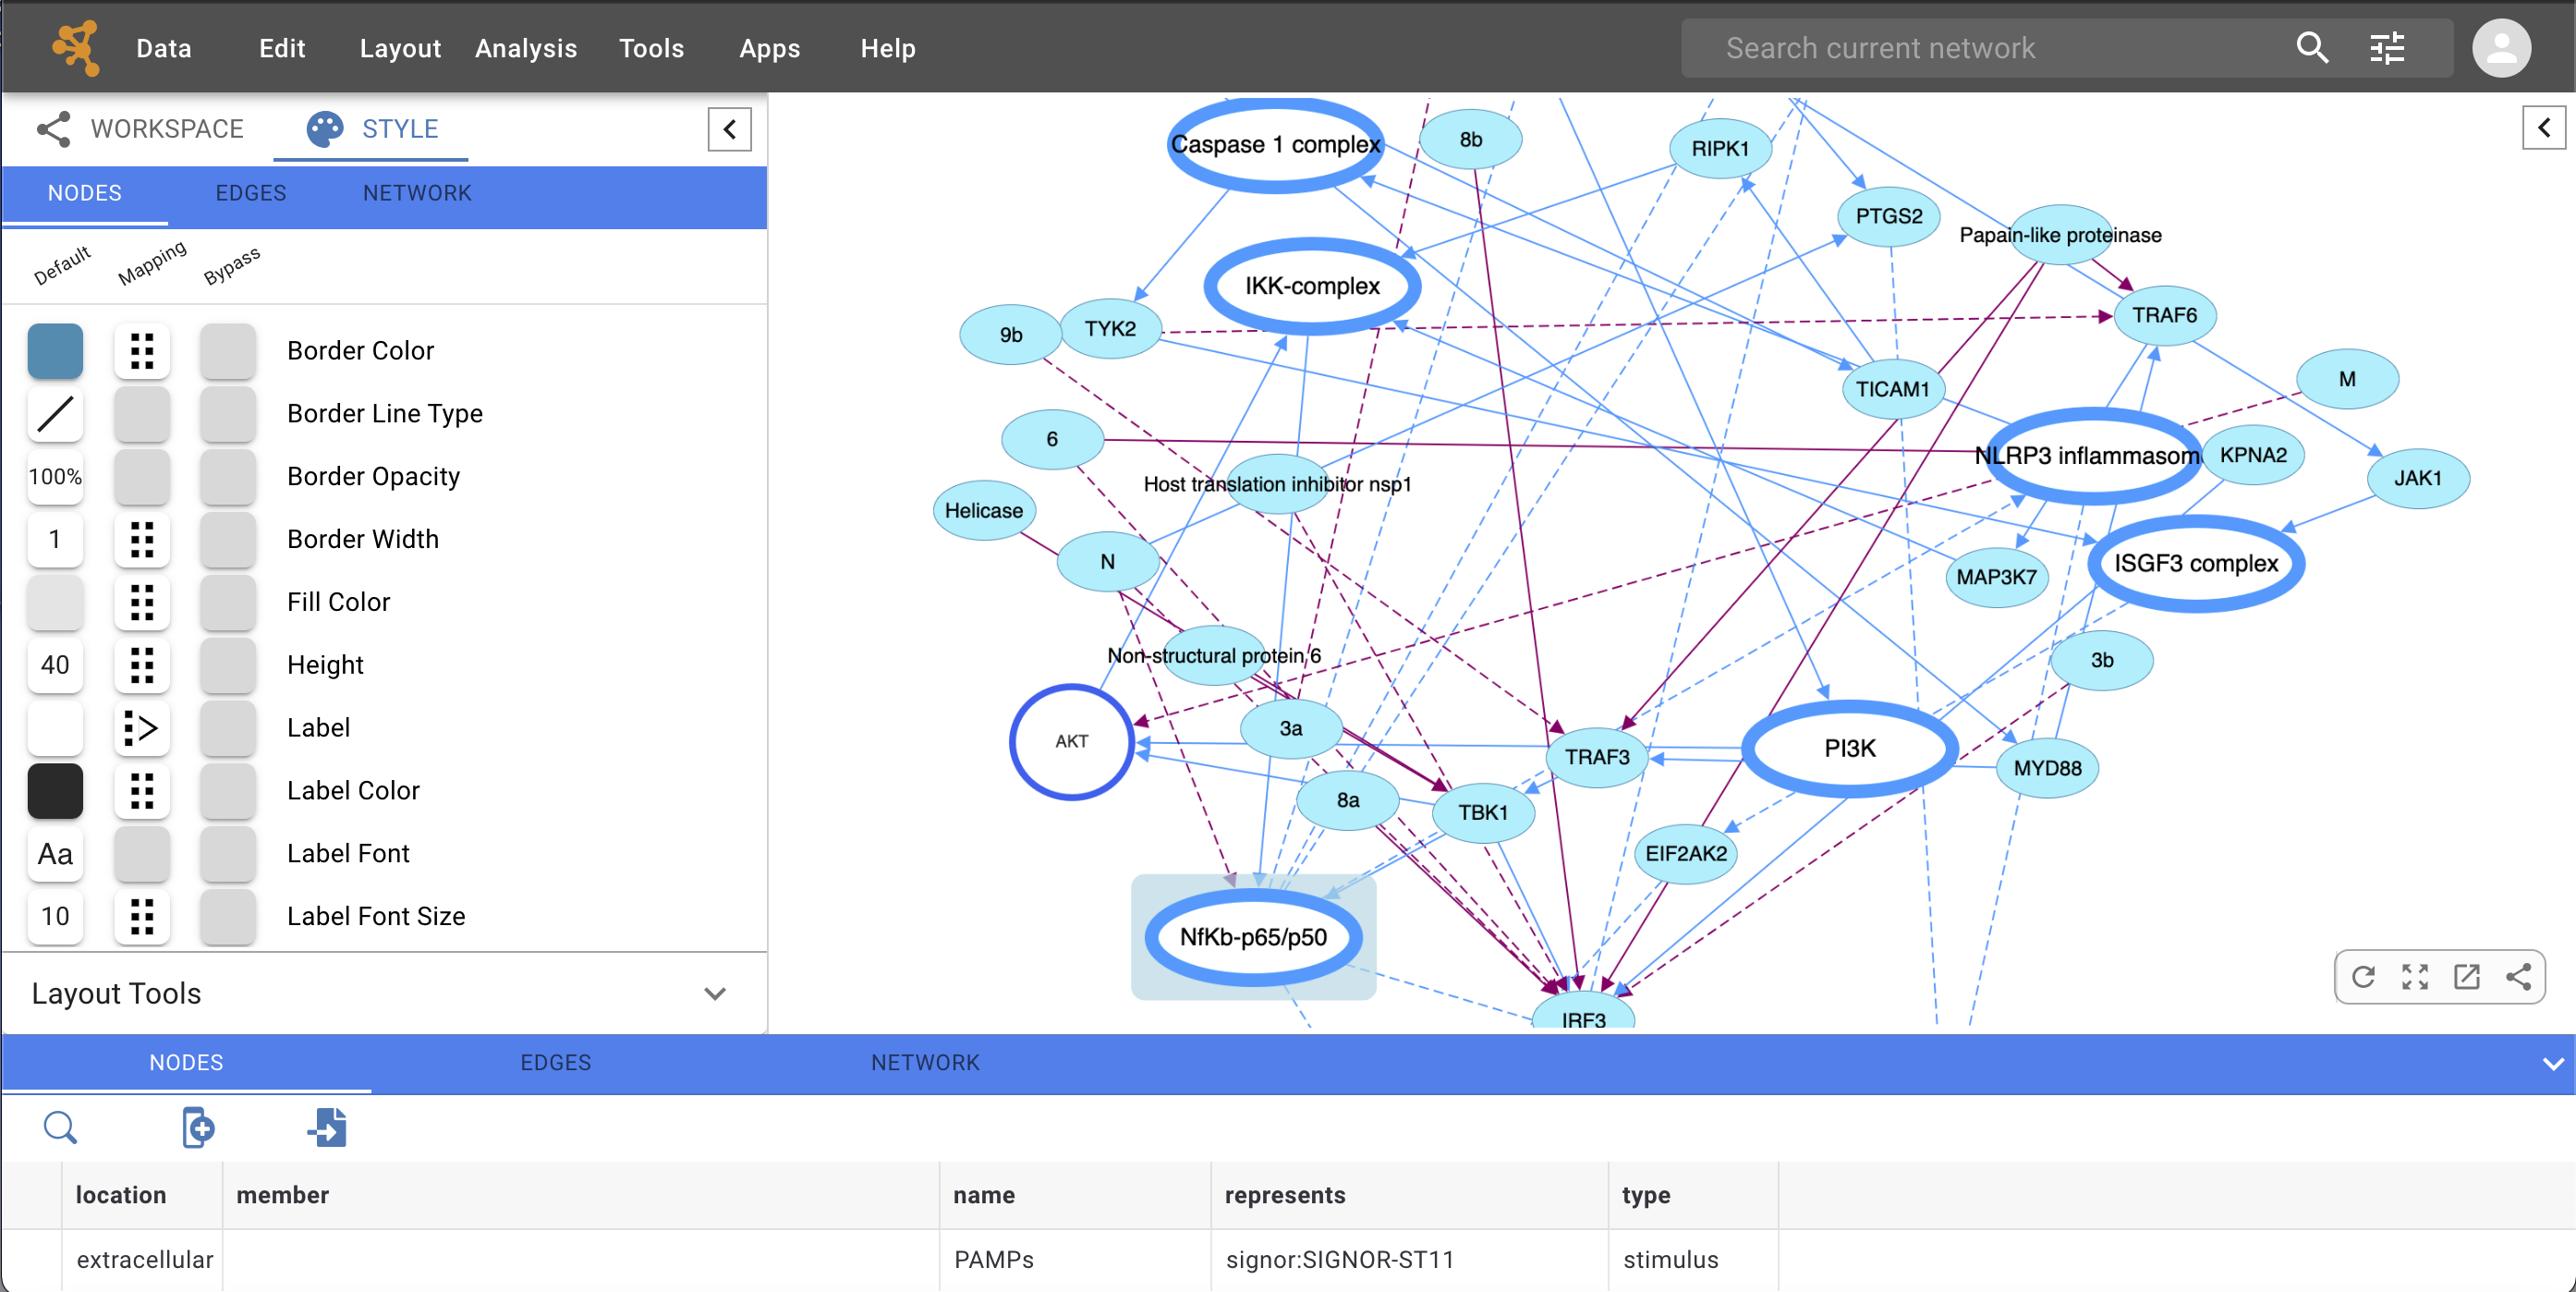
The Style Panel (STYLE tab in Control Panel), also know as VizMapper, provides the interface to create and manage the visual styles associated with your networks.
As shown below, even though the look and feel of the Style Panel is consistent with that of the Cytoscape desktop application, we recommend you review the chapter on Styles for detailed information and examples.
Layout Tools
The Layout Tools panel is available below the Workspace Panel; this panel is collapsed by default and can be expanded by clicking it.
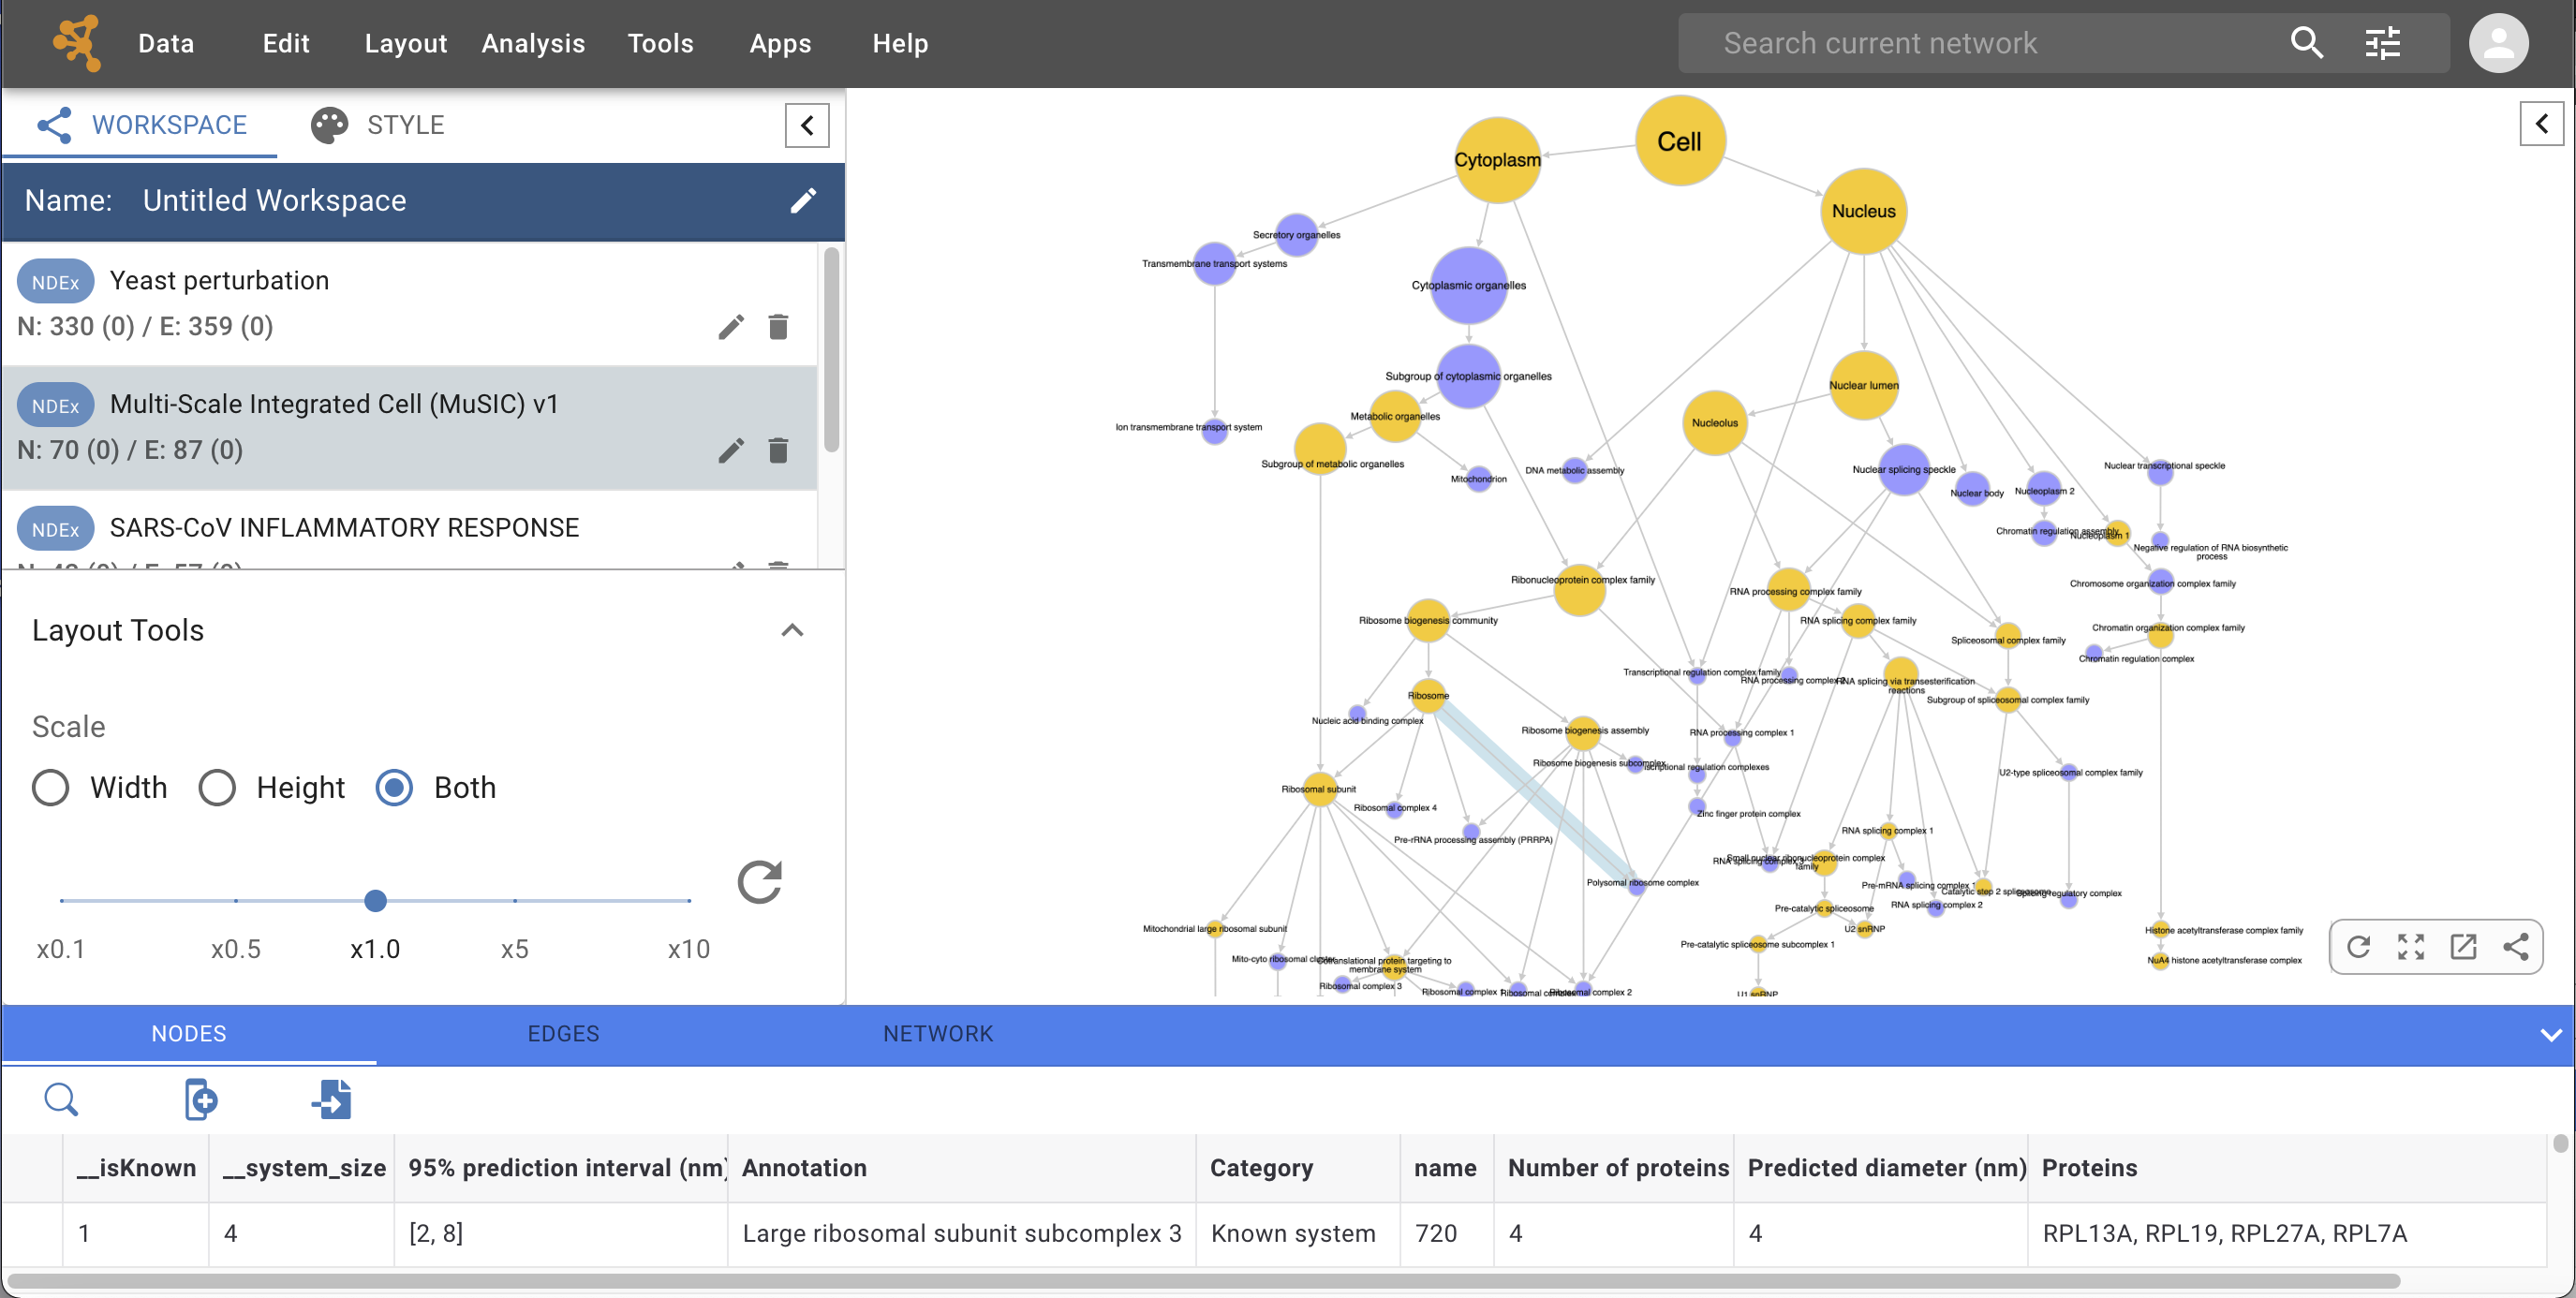
The Layout Tools let you adjust the height and width of the network either independently or together (both) by using an intuitive slider. The circular arrow button on the right resets only the slider’s position allowing additional adjustments.
2.3. Network Viewer
Network View Panel
This is where your selected network is displayed and you can interact with it. At the bottom right corner of the Network View Panel, 4 network view tools let users perform various operations as shown below:
 Apply Default Layout will apply the default network layout (G6: gForce) or whatever other layout you have specified as “default” in the Layout Settings.
 Fit Network to Window will resize the current network and fit it to the Network View Panel.
 Open in Cytoscape will open the current network in the Cytoscape desktop application if it is already running on your computer (default port: 1234).
 Share Network copies the URL of the current network to your computer’s clipboard so you can paste it in emails and other documents.
Cell View
If the currently selected network is a hierarchy, the interface will allow you to choose how you want to display the network. At the top of the Network View Panel, you’ll see two tabs: the standard Tree View and the new Cell View. Click it to switch to Cell View, also know as circle packing view:
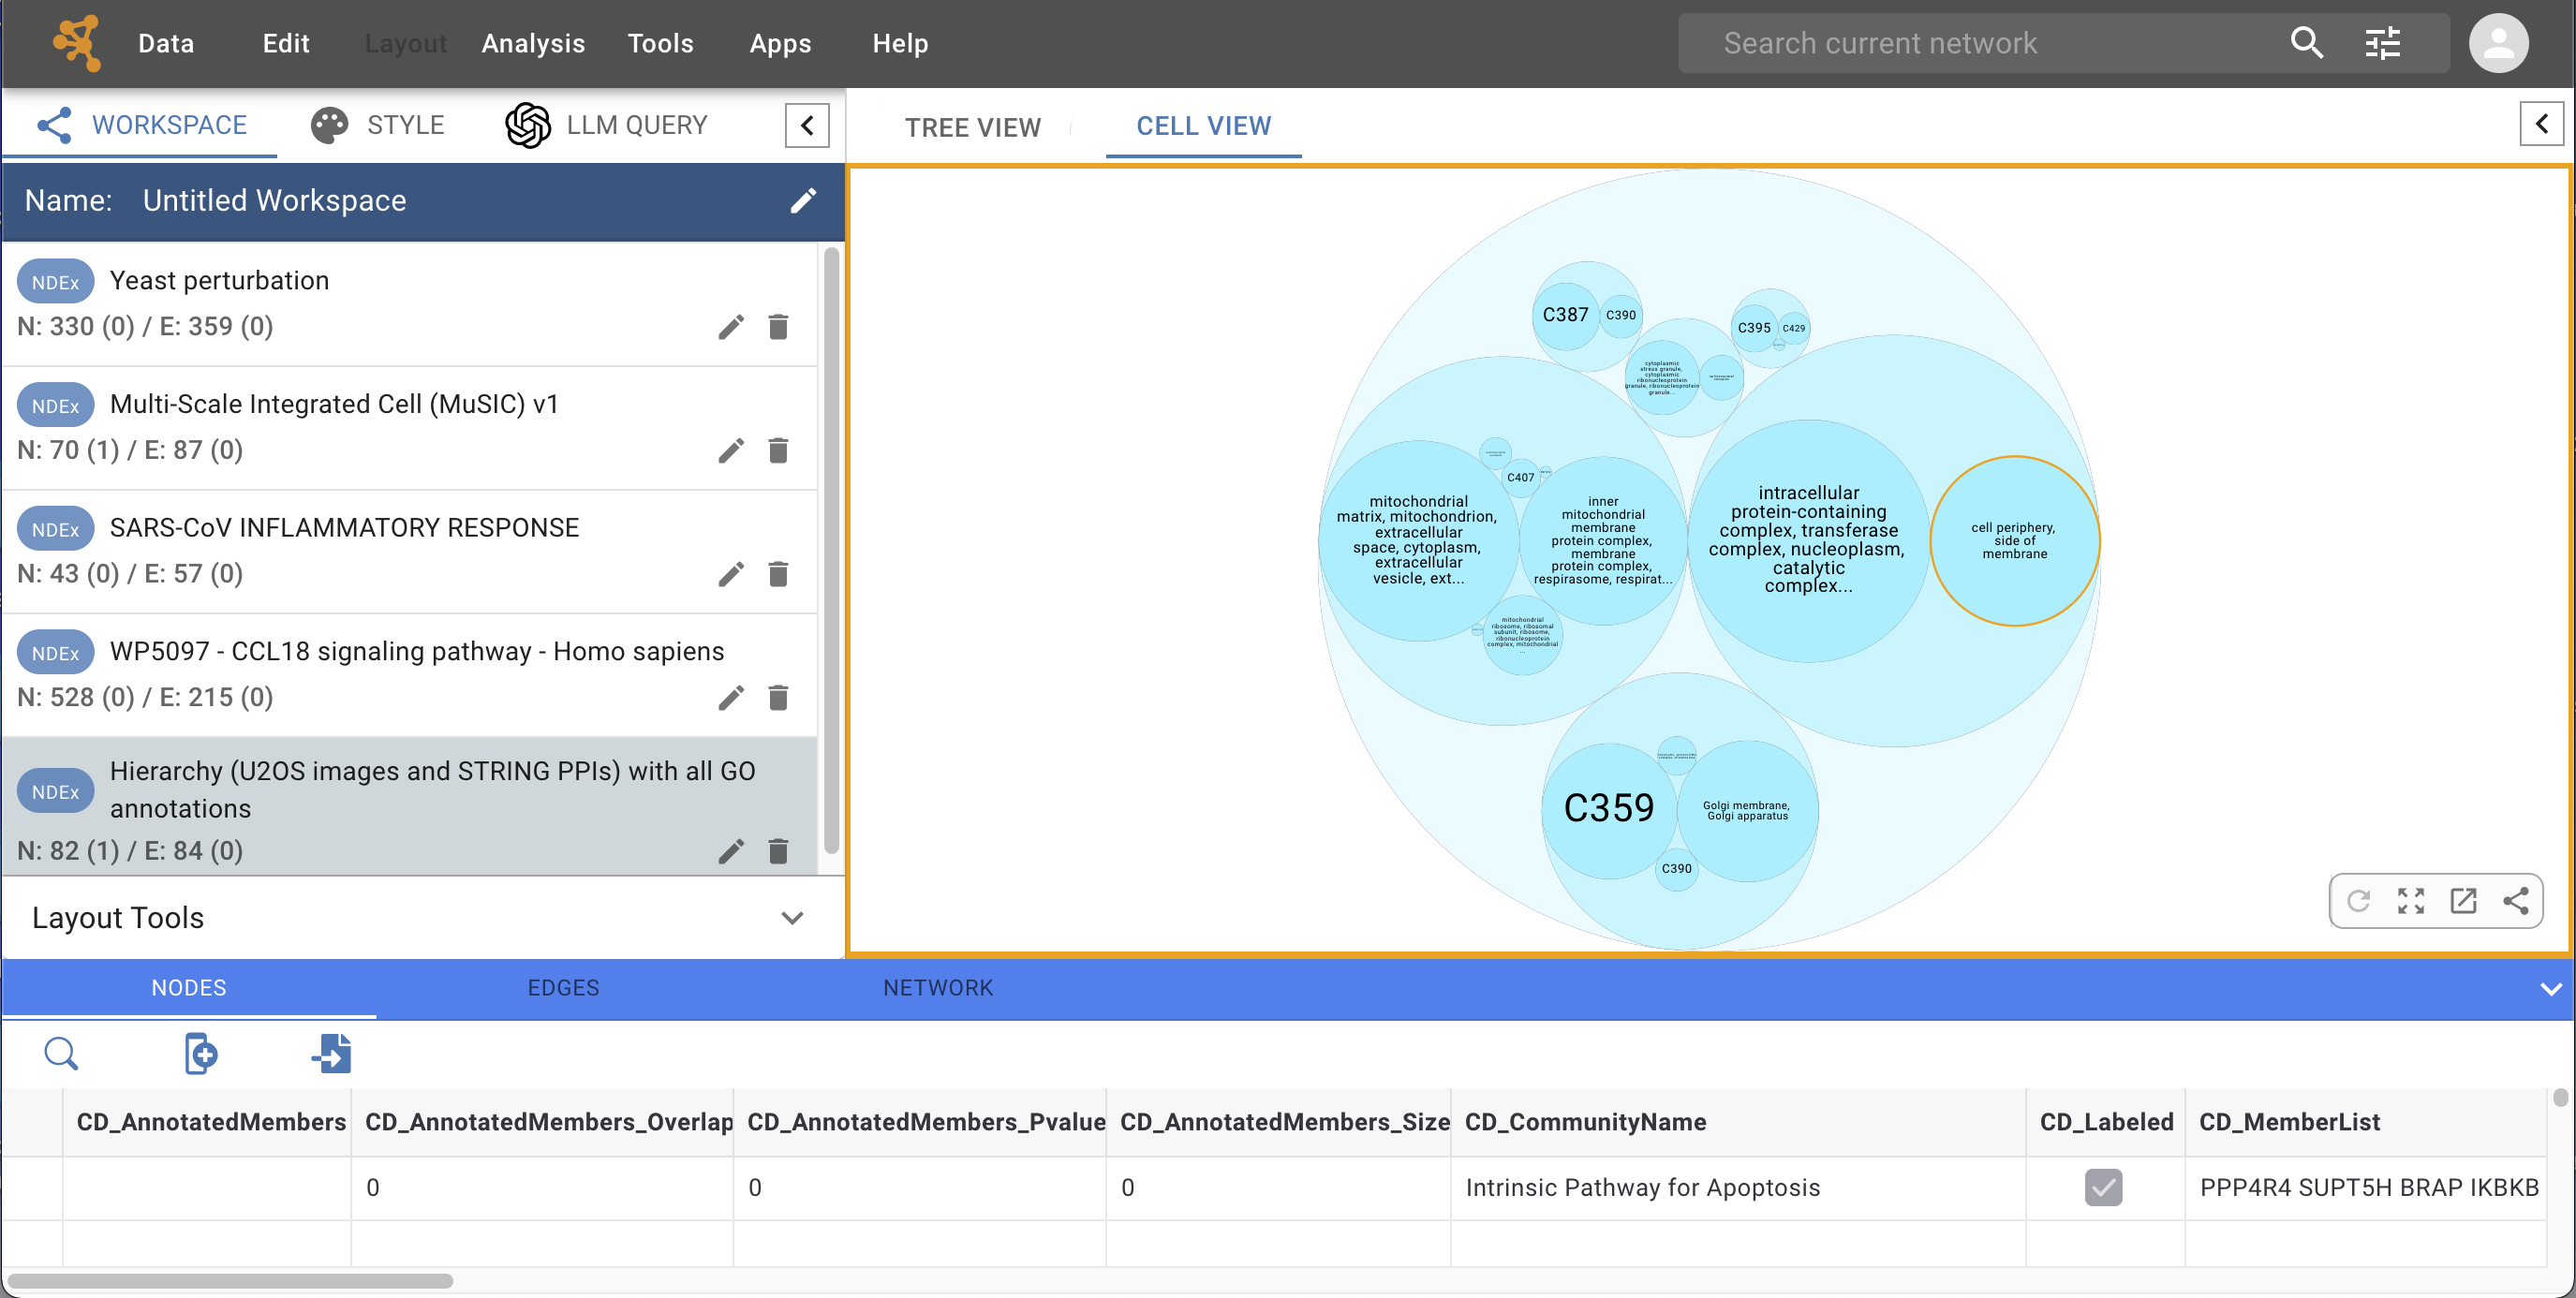
Cell View displays the network in systems (circles) that might or might not be nested. A fair comparison is to think about this type of representation as Matryoshka dolls.
Single click a system to select it. Double click it to zoom in and see the next-level systems (sub-systems).
When a system is selected, you can explore the underlying interaction network in the Sub Network Viewer panel:
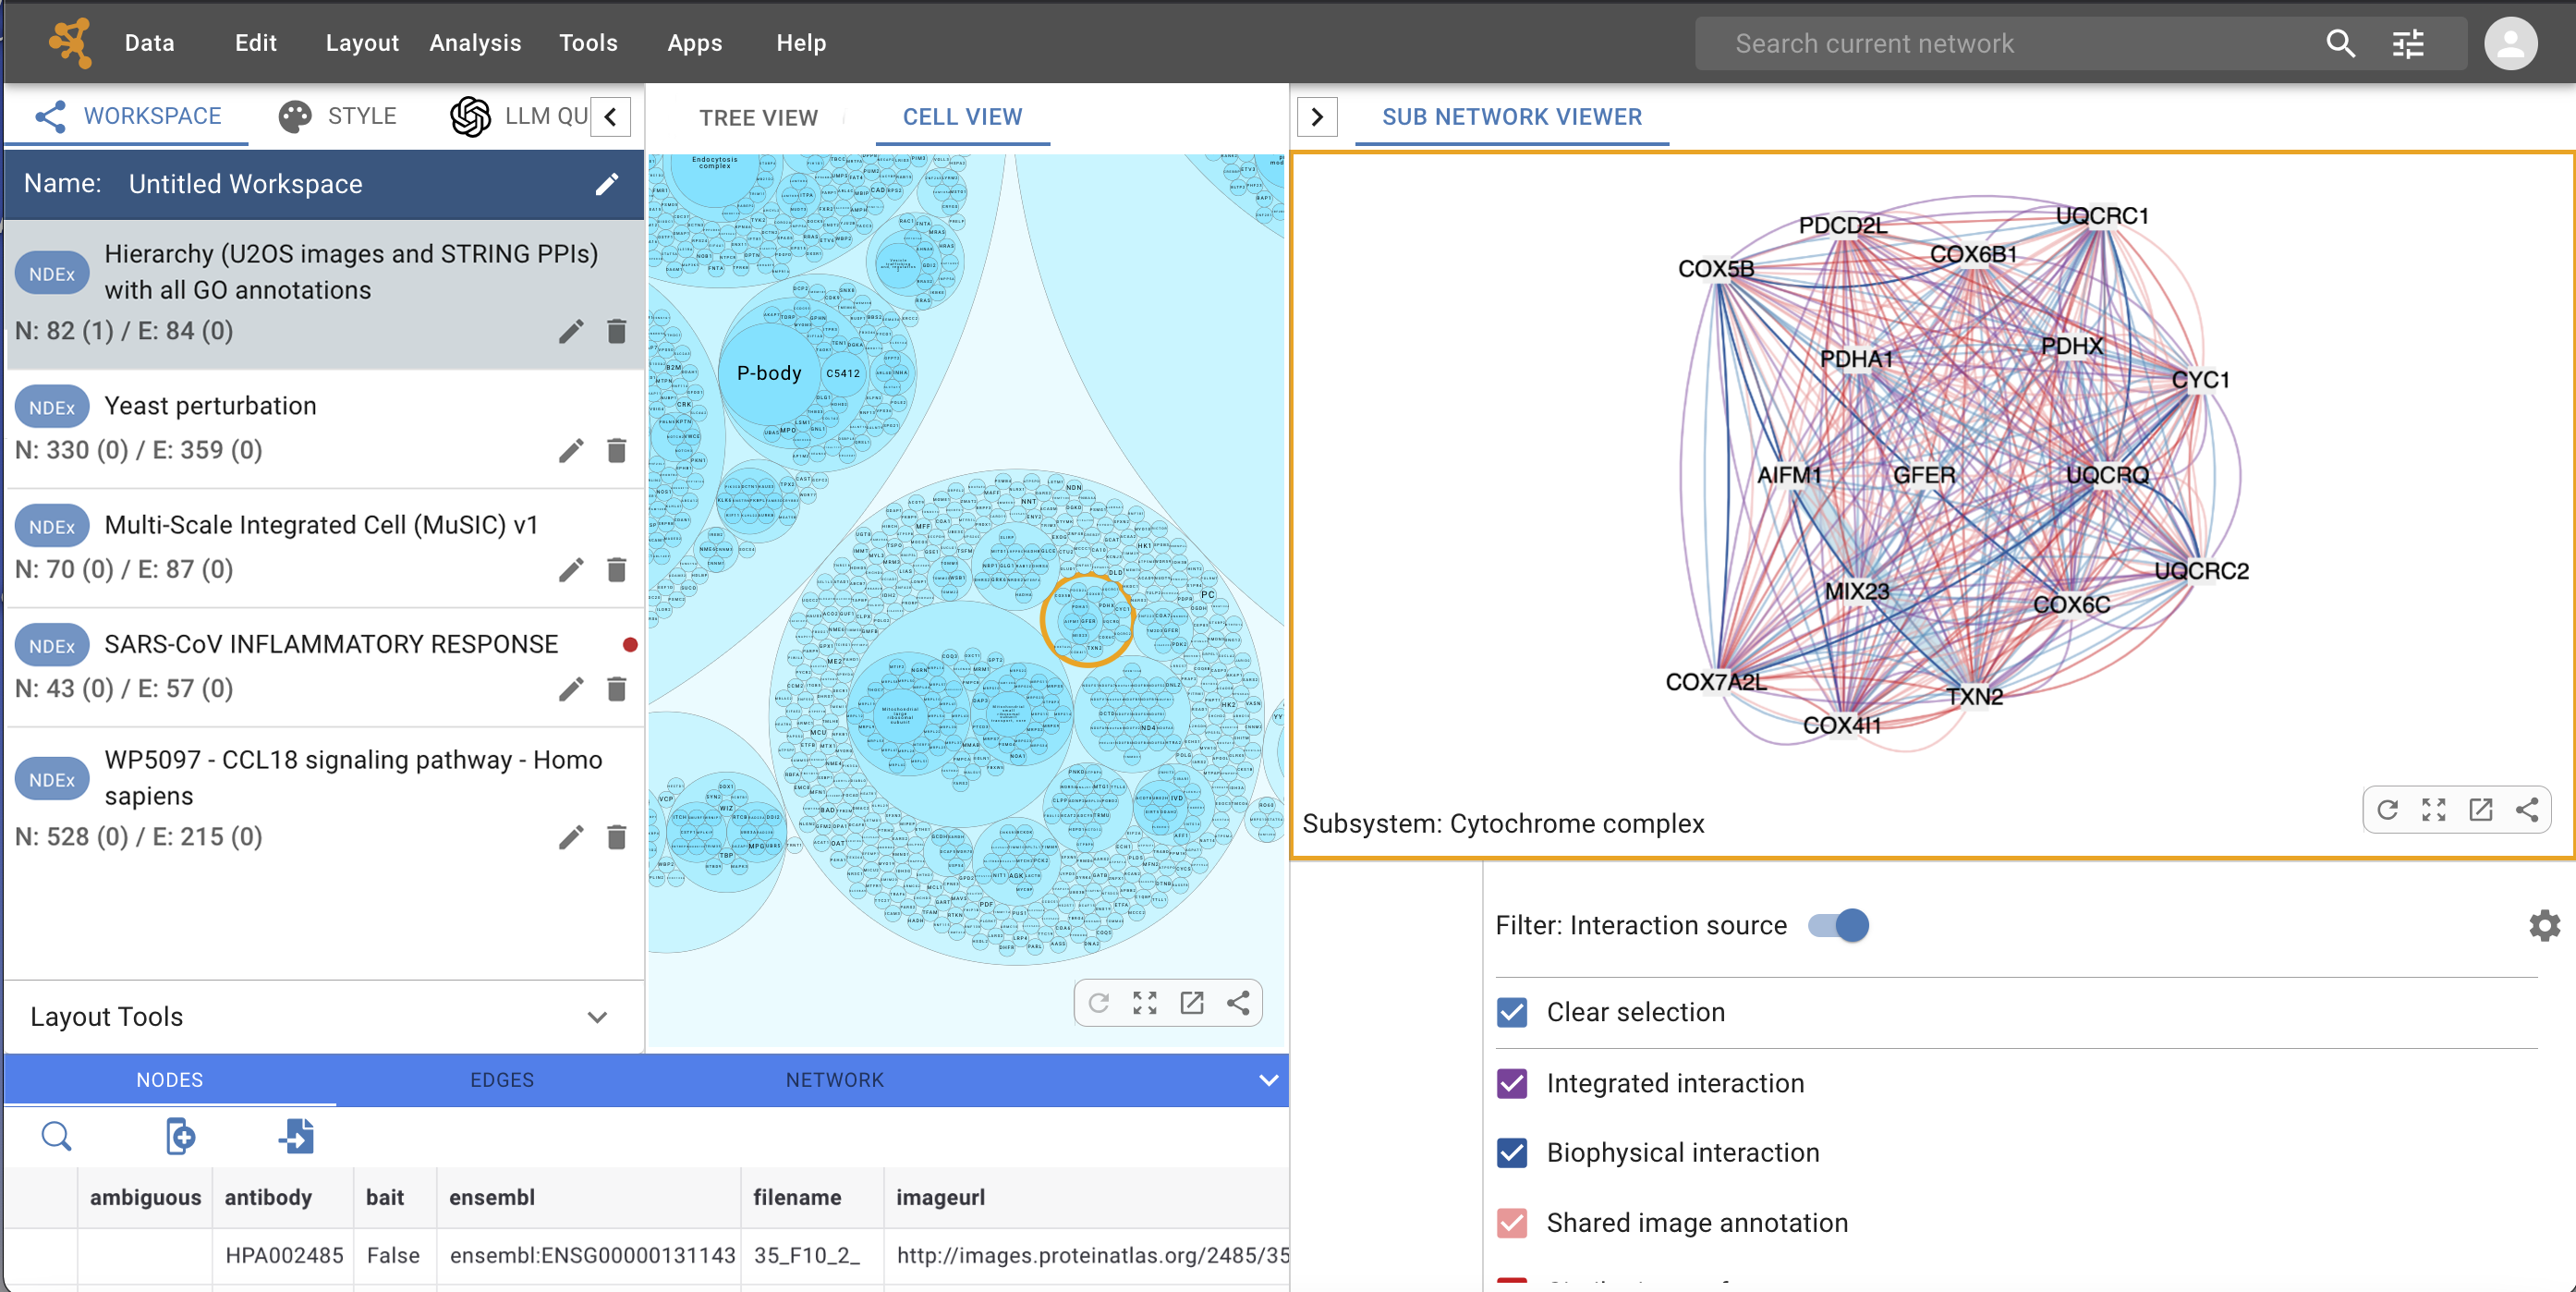
The Sub Network Viewer panel can be opened and closed using the  button in the top right corner of the Cell View window.
When the hierarchical model has more than 1 interaction data sources, filtering options will be available in the bottom part of the Sub Network Viewer panel, allowing you to explore the different sources of data available for the selected system.
2.4. Tables
Table Panel
At the bottom of the interface, the Table Panel allows you to view and modify your network’s data.
The Table Panel has a blue header with 3 tabs: NODES, EDGES and NETWORK, that contain the data columns (also known as attributes or properties) for each of those elements. The interface is the same for all 3 tabs, so we will only describe it in detail for the default table, the NODES table.
Like other interface features, the Table Panel can be minimized using the arrow button on the right hand side, or its size customized to user’s preference by dragging the blue header up and down. The image below shows the a custom sized panel with the NODES tab selected.
Consistently with the behavior in the Cytoscape desktop application, when no nodes are selected in the network view, the NODES table shows the data columns and values of all nodes in the network.
When one or more nodes are selected in the network view, the NODES table only shows the data for the selected nodes.
Above the column headers, we find a number of Table Tools:
 Allows to perform text-based search within the data columns.
 Allows to add a new columns to the existing table. Users can specify the name of the column, the datatype and an optional default value to populate the column if desired.
 Allows to import another table to add new data columns to the current table. Please review the chapter on Node and Edge Column Data for detailed information and examples.
Any cells in the table can be selected and its values edited. Click the cell once to select it, click it again to edit its content. If the content of the cell is a link, click the pencil icon to edit it. Multiple cells can be selected by combining mouse clicks with either the shift or command buttons on the keyboard.
When one or more cells in the table are selected, additional Table Tools will become available as shown below:
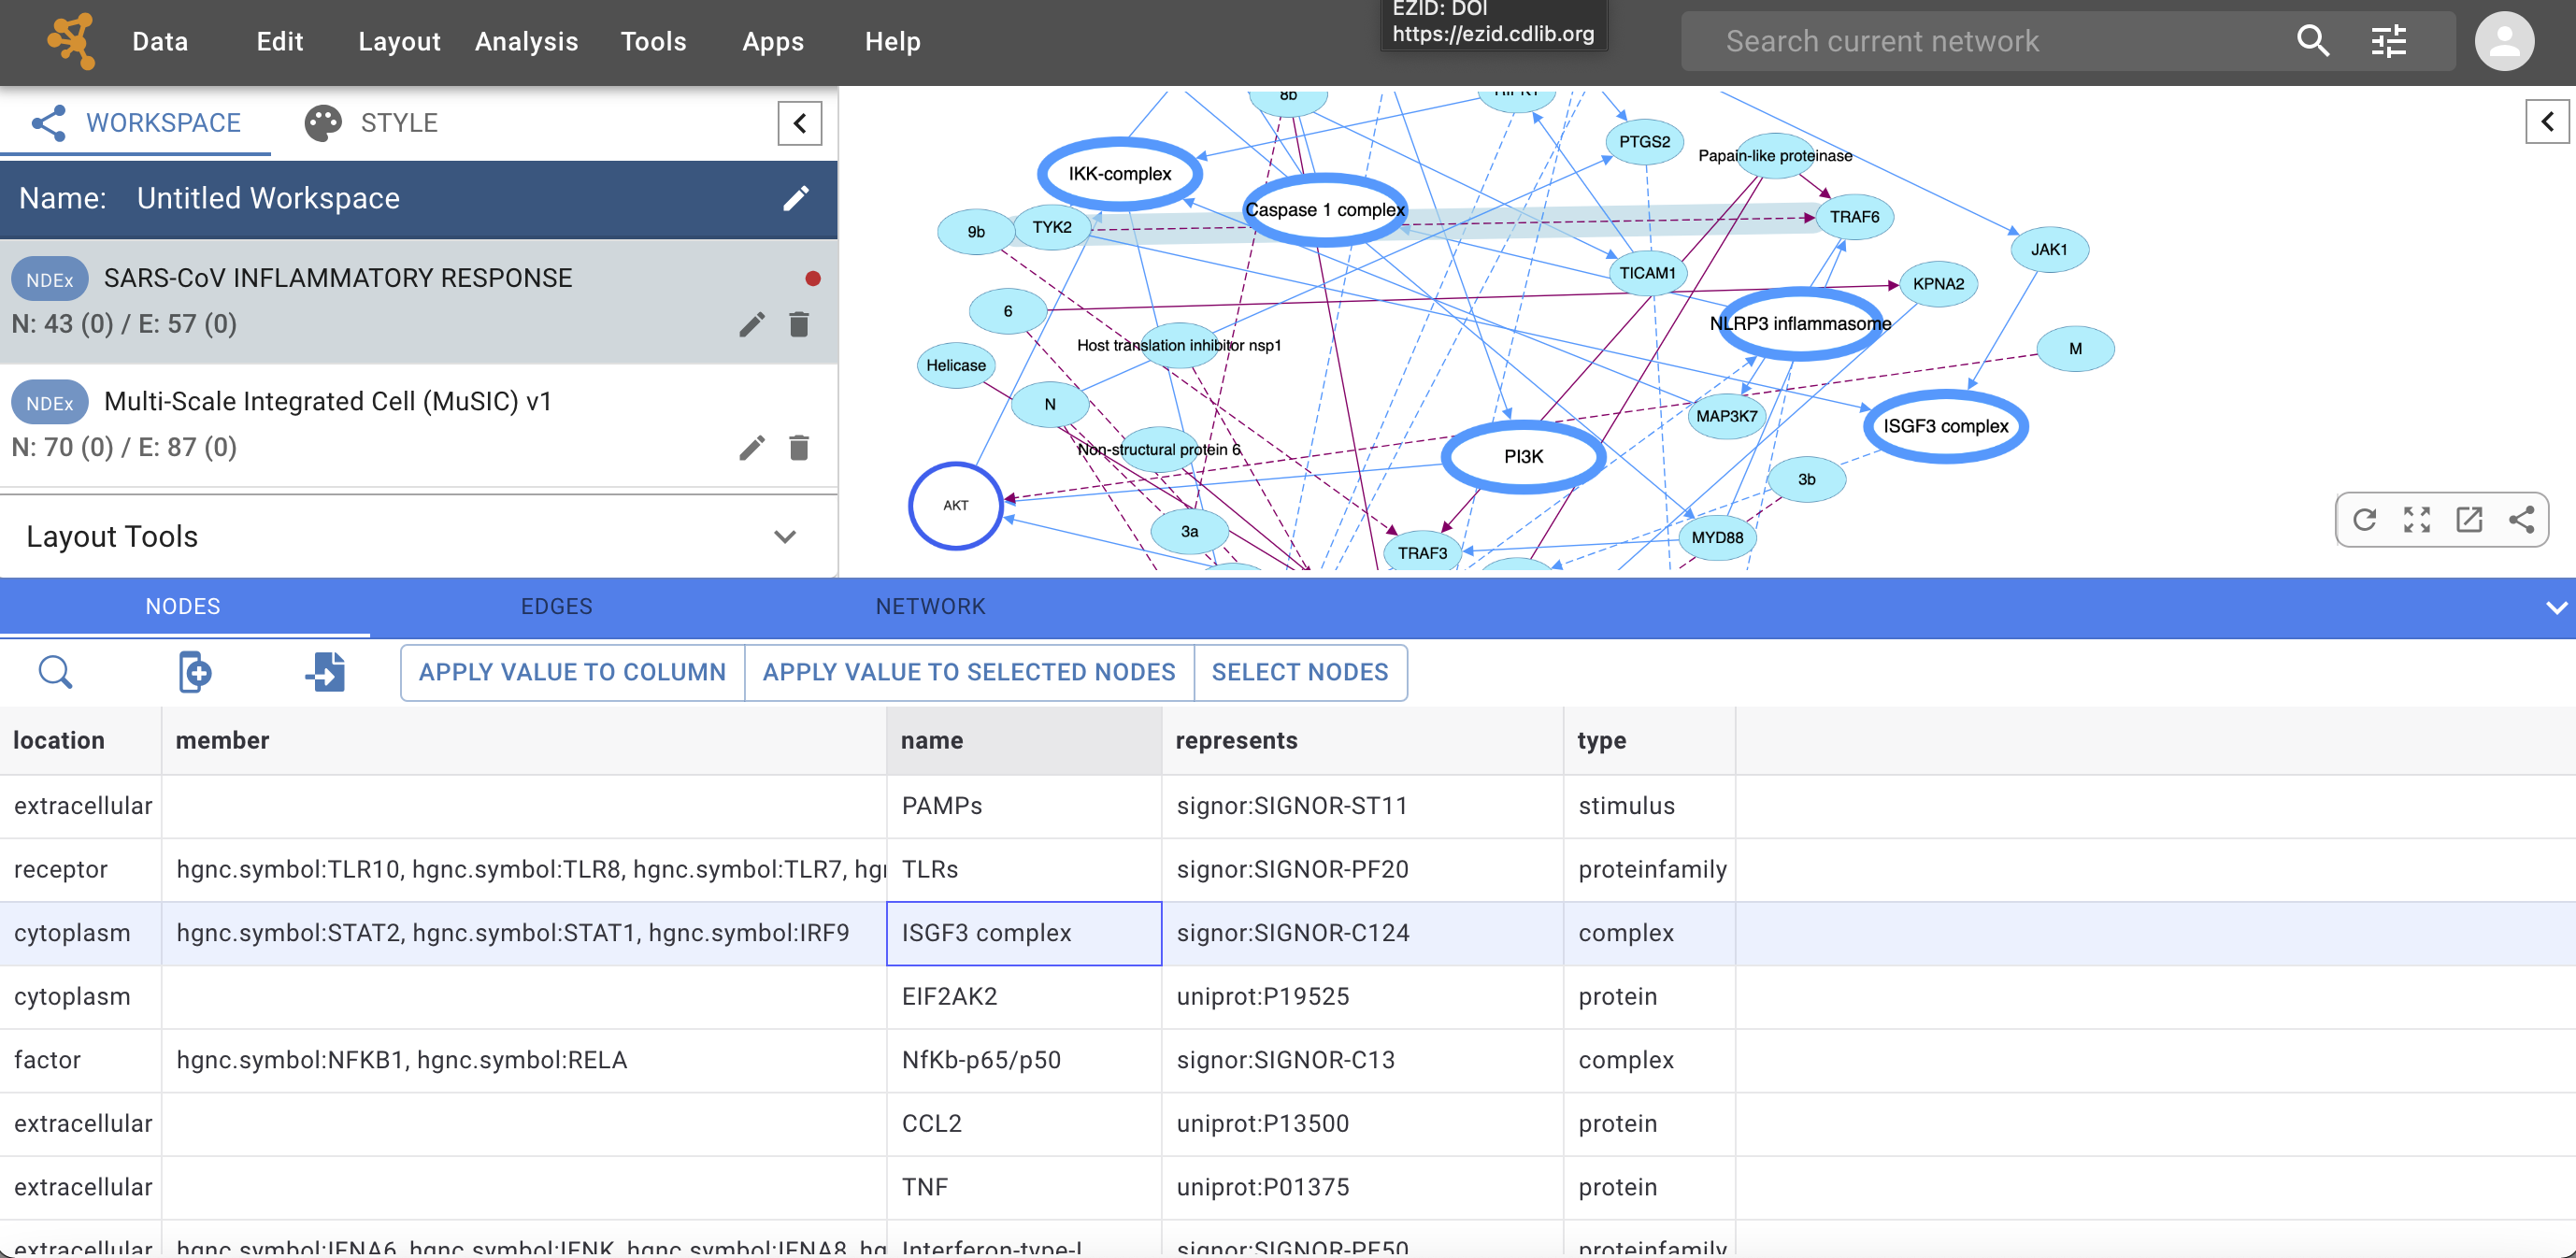
APPLY VALUE TO COLUMN: Applies the value of the selected cell to all cells in that column.
APPLY VALUE TO SELECTED NODES: Applies the value of the selected cell to the cells of all nodes selected in the network view (if any).
NOTE: These tools will modify your data and the changes are irreversible, please use them with caution.
SELECT NODES: Selects (highlights) the node in the network view corresponding to the selected cell in the table.